Your query returned 32 graphics.
Results 1 - 15
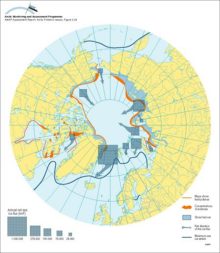
Approximate net sea ice exchange (see legend for key to arrow sizes), extent of shorefast ice and winter sea ice, and coastal polynyas and main polynya concentrationsApproximate net sea ice exchange (see legend for key to arrow sizes), extent of shorefast ice and winter sea ice, and coastal polynyas and main polynya concentrations |
|
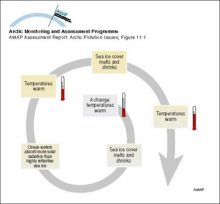
An example of a positive feedback loop Warming leads to a decrease in sea ice cover which in turn leads to a decrease in albedo over the ocean, the result of which is further warming and further decreases in the sea ice coverAn example of a positive feedback loop Warming leads to a decrease in sea ice cover which in turn leads to a decrease in albedo over the ocean, the result of which is further warming and further [..] |
|
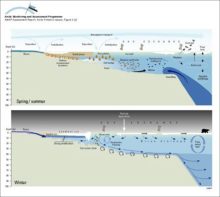
Schematic representation of shelf processes involving transport of contaminants and sea iceSchematic representation of shelf processes involving transport of contaminants and sea ice |
|
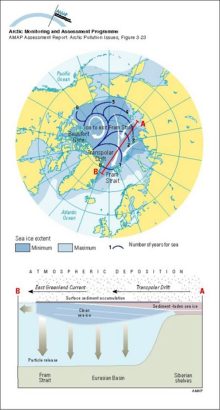
Average annual maximum and minimum sea ice extent The numbered lines show the expected time in years for the ice at that location to exit the Arctic Ocean through the Fram Strait, based on drifting buoy data during 1979-1990Average annual maximum and minimum sea ice extent The numbered lines show the expected time in years for the ice at that location to exit the Arctic Ocean through the Fram Strait, based on drifting [..] |
|
Major oil and gas development areas in Arctic Canada and on the Alaskan Beaufort Sea coastMajor oil and gas development areas in Arctic Canada and on the Alaskan Beaufort Sea coast |
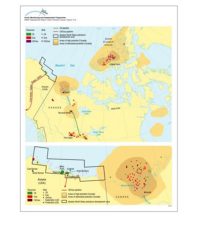
|
Major oil and gas development and potential development areas in Arctic Russia and the Barents Sea regionMajor oil and gas development and potential development areas in Arctic Russia and the Barents Sea region |
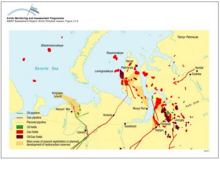
|
Major areas of oil and gas development and potential development in the Arctic, and major shipping routes and possible new routes through Arctic watersMajor areas of oil and gas development and potential development in the Arctic, and major shipping routes and possible new routes through Arctic waters |
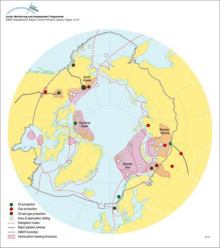
|
Oil and gas development areas in the Norwegian Sea and Norwegian Barents Sea regionsOil and gas development areas in the Norwegian Sea and Norwegian Barents Sea regions |
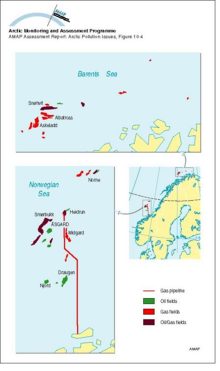
|
Map of main oil and gas transport routes from Russian Arctic production areasMap of main oil and gas transport routes from Russian Arctic production areas |

|
Generalized schematic diagram of oil and gas activitiesGeneralized schematic diagram of oil and gas activities |

|
Alaska quarterly oil and gas employmentAlaska quarterly oil and gas employment, 1968-2004, showing the sharp spike in construction employment during the building of the Alaska Pipeline in the mid-1970s followed by more stable, but lower, [..] |

|
Distribution of business activity around Norway from oil and gasDistribution of business activity around Norway from oil and gas, shown in relative levels of spending by area |

|
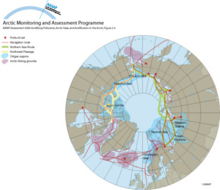
Shipping routes, oil and gas regions, and fishing grounds in the ArcticShipping routes, oil and gas regions, and fishing grounds in the Arctic |
|
Major Oil and Gas Provinces and basins around the ArcticMajor Oil and Gas Provinces (OGP) and basins around the Arctic |

|
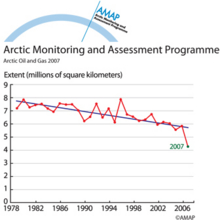
Recent observations of summer sea-ice extentRecent observations of summer sea-ice extent |
|

water OR waste searches for either of these words
oceans AND biodiversity searches for blocks with both words
pollution NEAR water searches for blocks with either of these words, with them being closer ranks higher
"climate change" searches for this phrase