Mnemiopsis in Turkish waters
First occurrence of Mnemiopsis from the Sea of Marmara was in October 1992 by Shiganova et al (1995). The average biomass (4200 g/m2) calculated by these authors was very high (Table 1). The values obtained later (in July 1993, April 1998 and October 2000) were very very low (less than 20 g/m2 in 1993 and close to zero in 1998 and 2000). Similar to Marmara case, after its first occurrence with values of 1.3 g/m3, the average values in Mersin Bay and Iskenderun Bay (northeastern Mediterranean) was again close to zero in subsequent years. Particularly Mediterranean data suggest that Mnemiopsis was not able to establish as an abundant species in this region. However it has been much more abundant in the Black Sea.
Table 1. Concentration of Mnemiopsis in the Turkish waters (excluding the Black Sea)
|
Region |
Date |
N |
Average Abundance | Average Biomass |
Reference |
Notes |
||
|
ind./m2 |
ind./m3 |
g/m2 |
g/m3 |
|||||
|
Mersin Bay (NE Med.) |
May-92 |
14 |
0.26 |
1.3 |
Kideys & Niermann 1993 |
>30 ind./m3 in BS |
||
|
max 1.1 |
max 7.4 |
|||||||
|
NE Mediterranean |
Jul-93 |
3 |
0.00 |
0 |
Kideys & Niermann 1994 |
|||
|
max 0 |
max 0 |
|||||||
|
Iskenderun Bay (NE Med) |
Feb-01 |
9 |
Gucu et al 2001 |
very rare |
||||
|
Aegean |
Jul-93 |
4 |
0.00 |
0 |
Kideys & Niermann 1994 |
only 1 ind. |
||
|
max 0.0002 |
max 0.002 |
|||||||
|
Dardanelles |
Jul-93 |
3 |
0.03 |
0.21 |
Kideys & Niermann 1994 |
|||
|
max 0.07 |
max 0.55 |
|||||||
|
Marmara |
Oct-92 |
16 |
4200 |
280 |
Shiganova et al. 1995 |
Assuming a 15 m thermocline |
||
|
max 7111202 |
max 474080 |
max 9725 |
max 648 |
depth |
||||
|
Marmara |
Jul-93 |
5 |
0.14 |
1.4 |
Kideys & Niermann 1994 |
|||
|
max 0.34 |
max 3.5 |
|||||||
|
Marmara |
Apr-98 |
8 |
0.02 |
0.09 |
Kideys unpublished data |
|||
|
max 0.17 |
max 0.69 |
|||||||
|
Marmara |
Oct-00 |
6 |
0.00 |
0 |
Kideys unpublished data |
7 Beroe caught! |
||
|
0.00 |
0 |
|||||||
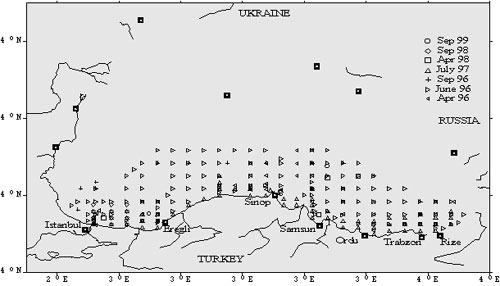
Figure 1. Sampling stations in the southern Black Sea.
Spatial and temporal distributions of three gelatinous macrozooplankton, the scyphozoan Aurelia aurita and ctenophores Pleurobrachia pileus and Mnemiopsis leidyi (and of Beroe since 1999) were evaluated by using data collected from 7 southern Black Sea cruises carried out from 1995 to 1999.
As can be seen in Table 2, a comparison of nets used for the sampling of gelatinous macrozooplankton illustrated the superiority of the Hensen net with a larger mesh size (300 m m) than the Nansen net (112 m m).
Table 2. Comparison of catchability between Nansen and Hensen nets (June-July 1996, n=20). All values as per haul.
|
A. aurita |
M. leidyi |
P. pileus |
||||
| # | Wt (g) | # | Wt (g) | # | Wt (g) | |
| Mean Nansen | 2.6 | 28.9 | 11.1 | 34.5 | 24.4 | 13.0 |
| Mean Hensen | 3.2 | 71.6 | 25.9 | 85.1 | 75.3 | 42.7 |
| Hensen Nansen Ratio | 1.5 | 3.1 | 2.6 | 2.7 | 3.1 | 3.3 |
Overall Ratio 2.7
P. pileus was mainly concentrated below the mixed layer, while A. aurita and M. leidyi were generally confined to surface waters. Horizontally, P. pileus was associated with the deep, offshore waters. P. pileus also displayed the least interannual variation of the three species. Biomass of A. aurita and M. leidyi varied substantially seasonally and through the years. In September 1999, the average biomass of M. leidyi was at its lowest level (12 g wet weight m-2) since its mass explosion at the end of the 1980’s. This was associated with the appearance of the new predatory ctenophore, Beroe ovata which appeared in the Black Sea at the end of the 1990’s. Moreover average Mnemiopsis biomass was close to zero in July 2000 cruise where only 4 individuals were caught in nets from a total of 81 samples.
It could be suggested that the low biomass values of M. leidyi obtained from the last cruises will be maintained due to its efficient predator B. ovata. Given the importance of M. leidyi on the pelagic food web, the implication of such a relationship on the distribution and quantity of other gelatinous zooplankton, as well as on prey zooplankton and consequently on fish will be of potential significance in the Black Sea.
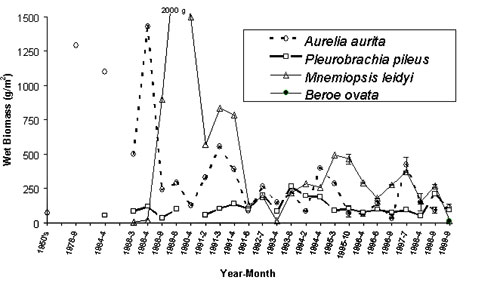
Figure 3. Long term variations in the biomass of macrogelatinous zooplankton in the Black Sea.
For more information on Black Sea data please see the following reference:
Kideys AE & Z. Romanova 2001. Distribution of gelatinous macrozooplankton in the southern Black Sea during 1996-1999. Marine Biology (In press).
Document Actions