Resources / Maps & Graphics / Collections / AMAP Assessment 2006: Acidifying Pollutants, Arctic Haze and Acidification in the Arctic
AMAP Assessment 2006: Acidifying Pollutants, Arctic Haze and Acidification in the Arctic
Publisher: Arctic Monitoring and Assessment Programme (AMAP), Publication date: 2006
, Published in series:
AMAP Assessments
AMAP 2006 scientific assessment
See the AMAP Assessment 2006: Acidifying Pollutants, Arctic Haze and Acidification in the Arctic web-site for full details.
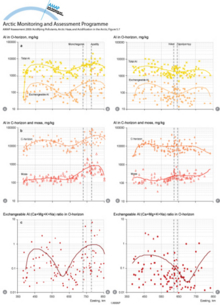
A comparison of the two west–east transects across the survey area in 1995A comparison of the two west–east transects across the survey area in 1995, showing changes from east to west in (a) total Al (nitric acid) and exchangeable Al concentrations in the O-horizon; (b) [..] |
|
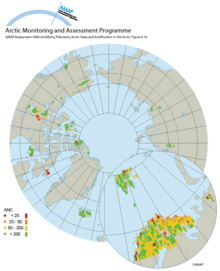
Acidity of snow cover across the Russian Arctic, 2001–2004Acidity of snow cover across the Russian Arctic, 2001–2004 |
|
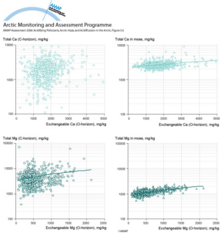
Ammonium acetate extractable Ca and Mg in the O-horizon of soilsAmmonium acetate extractable Ca and Mg in the O-horizon of soils (x-axis) vs. their total concentrations (aqua regia extractable) in the C-horizon of soils and in moss in 1995 |
|
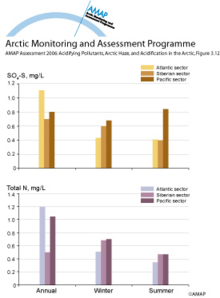
Annual and seasonal variations in average background levels of sulfate sulfur and total nitrogen in precipitation across the AtlanticAnnual and seasonal variations in average background levels of sulfate sulfur and total nitrogen in precipitation across the Atlantic, Siberian, and Pacific sectors of the Russian Arctic |
|
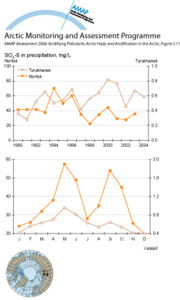
Annual and seasonal variations in sulfate sulfur concentrationsAnnual and seasonal variations in sulfate sulfur concentrations in an industrial area (Norilsk) and a background area (Turukhansk) of the Siberian sector of the Russian Arctic |
|
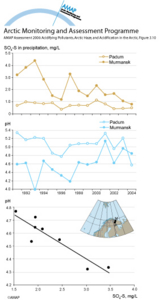
Annual average sulfate sulfur concentrations and pH in precipitation within the Russian ArcticAnnual average sulfate sulfur concentrations and pH in precipitation within the Russian Arctic at a heavily impacted site (Murmansk) and a background site (Padun) since 1991, and the correlation [..] |
|
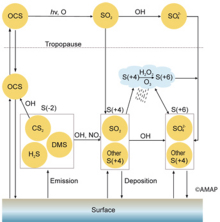
Atmospheric sulphur cycleAtmospheric sulphur cycle |
|
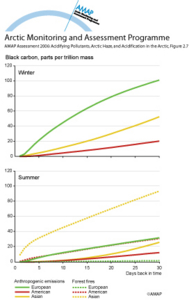
Black carbon potential source contributionsBlack carbon potential source contributions from continents as a function of transport time to the Arctic, for the subset that also reaches a minimum arctic altitude below 1000 m, for winter and [..] |
|
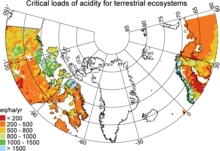
Critical loads of acidity for soilsCritical loads of acidity for terrestrial ecosystems in northern Europe and Canada north of 60 degrees N. |
|
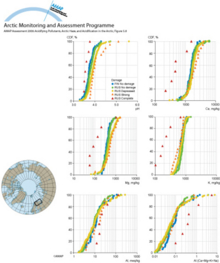
Cumulative distribution functions (CDF, %) of pH (water extraction)Cumulative distribution functions (CDF, %) of pH (water extraction), exchangeable Ca, Mg, K, and Al concentrations and the exchangeable Al:(Ca+Mg+K+Na) ratio in the O-horizon in the ‘no visual damage’ [..] |
|
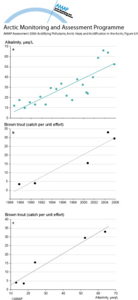
Data for Lake Otervatn in eastern Finnmark, showing alkalinity and brown trout catch per unit effortData for Lake Otervatn in eastern Finnmark, showing (a) alkalinity (μeq/L) and (b) brown trout catch per unit effort (CPUE, expressed in number of fish caught per 100 m2 of gill net area) since 1986, [..] |
|
Diatom-inferred Holocene pH histories of lakes in arctic Fennoscandia and the Kola PeninsulaDiatom-inferred Holocene pH histories of lakes in arctic Fennoscandia and the Kola Peninsula. Toskaljavri (a) is redrawn from Seppä et al. (2002), Tsuolbmajavri (b) from Seppä and Weckström (1999), [..] |
|
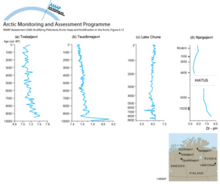
Diatom-inferred recent pH-histories of 14 lakes and ponds in northern FennoscandiaDiatom-inferred recent pH-histories of 14 lakes and ponds in northern Fennoscandia. Note the different scales for age and pH. Figures A-C are from Korhola et al. (1999), D-E from Erola (1999), F-G [..] |
|
Estimated emissions of SOx-S and NOx-N in 2000Estimated emissions of SOx-S and NOx-N in 2000 |
|
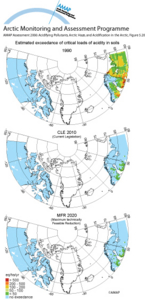
Estimated exceedance of critical loads of acidity for soils for three emission/deposition scenariosEstimated exceedance of critical loads of acidity for soils for three emission/deposition scenarios: 1990 emissions, the CLE scenario for 2010 (CLE, 2010), and the MFR scenario for 2020 (MFR, 2020). |
|
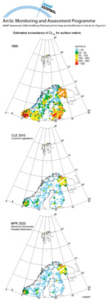
Estimated exceedance of critical loads of acidity for surface waters in northern Europe for three scenariosEstimated exceedance of critical loads of acidity for surface waters in northern Europe for three scenarios: 1990 emissions, Current Legislation for 2010 (CLE 2010), Maximum technically Feasible [..] |
|
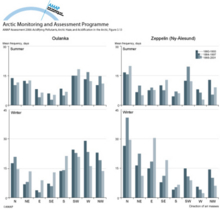
Frequency and variation in the direction of air massesFrequency and variation in the direction of air masses arriving at Oulanka and Zeppelin over 4-year periods during the 1990s |
|
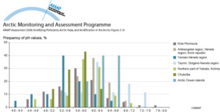
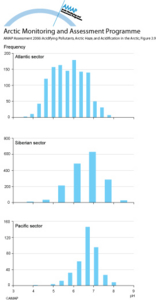
Frequency distribution for monthly pH values in precipitation within the Russian Arctic for the AtlanticFrequency distribution for monthly pH values in precipitation within the Russian Arctic for the Atlantic, Siberian, and Pacific sectors for 1990 to 2004 |
|
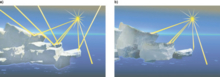
Impact of soot deposited onto snow and ice surfaces in the ArcticImpact of soot deposited onto snow and ice surfaces in the Arctic. Polar ice reflects light from the sun back to space (a). As the ice begins to melt, less light is reflected and more is absorbed by [..] |
|
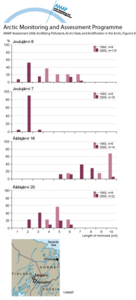
Length distributions of minnows caught by electrofishing in the Joulujärvi areaLength distributions of minnows caught by electrofishing in the Joulujärvi area (sites 6 and 7), and in the Äälisjärvi area (sites 16 and 20) in 1993 and 2000 |
|
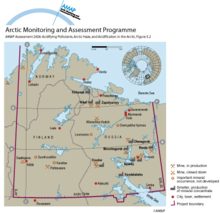
Location of the catchments included in the Barents ProjectLocation of the catchments included in the Barents Project |
|
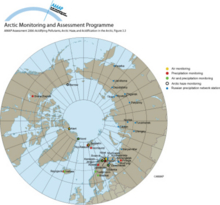
Locations of background monitoring stations for air and precipitation chemistryLocations of background monitoring stations for air and precipitation chemistry, and arctic haze and the Russian precipitation chemistry stations |
|
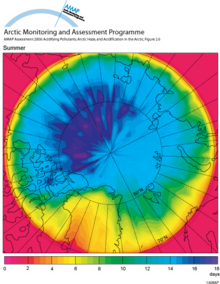
Mean arctic age of air in the lowest 100 m of the atmosphere (summer)Mean arctic age of air in the lowest 100 m of the atmosphere in July (summer) |
|
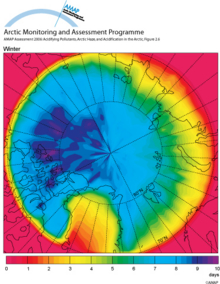
Mean arctic age of air in the lowest 100 m of the atmosphere (winter)Mean arctic age of air in the lowest 100 m of the atmosphere in January (winter) |
|
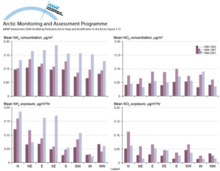
Mean concentration and exposure to nitrogen compounds at ZeppelinMean concentration and exposure to nitrogen compounds at Zeppelin in relation to the direction of air masses arriving at the station in the 1990s |
|
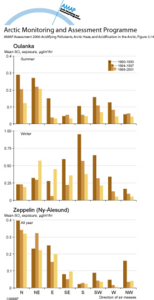
Mean exposure to sulfur dioxide at Oulanka and ZeppelinMean exposure to sulfur dioxide at Oulanka and Zeppelin in relation to the direction of air masses arriving at the stations in the 1990s |
|
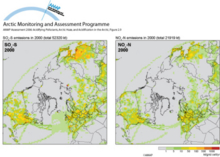
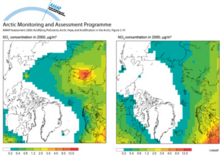
Mean surface air concentrations of sulfur oxidesMean surface air concentrations of sulfur oxides (i.e., sulfur dioxide plus sulfate) and nitrate in 2000 |
|
Median values for a selection of key chemical variablesMedian values for a selection of key chemical variables including the calculated critical load of acidity CLAc and exceedance |
|
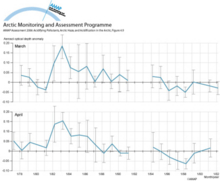
Monthly averaged aerosol optical depth anomalies at Barrow for March and AprilMonthly averaged aerosol optical depth anomalies at Barrow (Alaska) for March and April. The anomalies are relative to a base of non-volcanic years. Data from 1992 and 1993 were removed due to [..] |
|
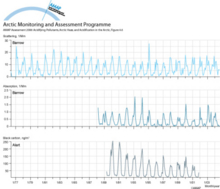
Monthly averaged light scattering and absorption at 550 nm by <10 μm aerosol at Barrow and black carbon concentrations at AlertMonthly averaged light scattering and absorption at 550 nm by <10 μm aerosol at Barrow (Alaska) and black carbon concentrations at Alert (Canada) |
|
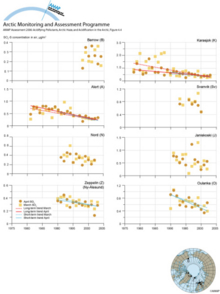
Monthly averaged sulfate concentrations for March and April at eight arctic monitoring sitesMonthly averaged sulfate concentrations for March and April at eight arctic monitoring sites and Sen’s slope estimates for the long term (approximately 1980 through the available data) and short term [..] |
|
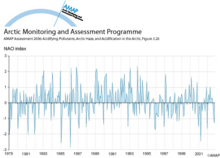
NAO index for the period 1979 to 2002NAO index for the period 1979 to 2002 |
|
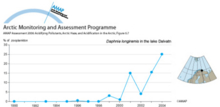
Presence of the acidsensitive cladoceran Daphnia longiremis in Lake DalvatnPresence of the acidsensitive cladoceran Daphnia longiremis in Lake Dalvatn (Varanger Peninsula, Norway) |
|
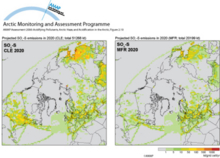
Projected SOx-S emissions in 2020 for the CLE and MFR emissions scenariosProjected SOx-S emissions in 2020 for the CLE and MFR emissions scenarios |
|
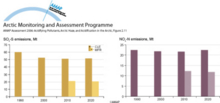
Projected total emissions of SOx-S and NOx-N between 1990 and 2020Projected total emissions of SOx-S and NOx-N between 1990 and 2020 |
|
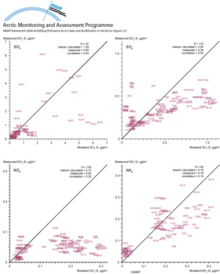
Scatterplots comparing measured and modeled annual average concentrations of sulfur dioxide, sulfate, nitrate and ammoniumScatterplots comparing measured and modeled annual average concentrations of sulfur dioxide, sulfate, nitrate and ammonium at arctic monitoring stations for 1991 to 2000. Labels on graphs refer to [..] |
|
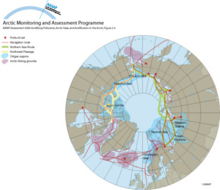
Shipping routes, oil and gas regions, and fishing grounds in the ArcticShipping routes, oil and gas regions, and fishing grounds in the Arctic |
|
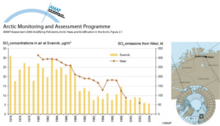
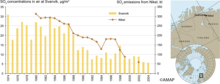
SO2 concentration at the Svanvik monitoring stationAnnual SO2 concentration in air at ground level at the Svanvik monitoring station and SO2 emissions from the non-ferrous metal smelters at Nikel |
|
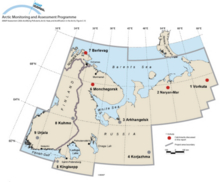
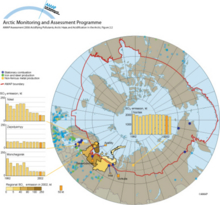
Sulfur dioxide emissions from metallurgical industry sourcesSulfur dioxide emissions from metallurgical industry sources and major coal-fired power plants in Russia (there are no significant point sources north of 60º N in other Arctic countries; pale coloured [..] |
|
Sulphur dioxide concentrations in air and emissions from the smelter at NikelAnnual SO2 concentrations in air at ground level at the Svanvik monitoring station, and SO2 emissions from the non-ferrous metal smelters at Nikel |
|
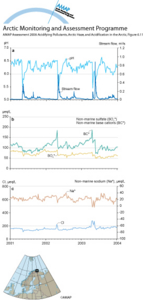
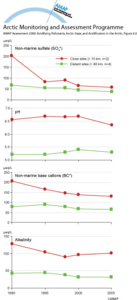
Surface water runoff from the Dalelva catchment, northeastern Norway, 2001–2003Surface water runoff from the Dalelva catchment, northeastern Norway, 2001–2003. (a) streamwater flow and pH, (b) non-marine concentrations of sulfate and base cations, and (c) chloride and non-marine [..] |
|
The Kola Ecoregion survey area and major industrial centersThe Kola Ecoregion survey area and major industrial centers |
|
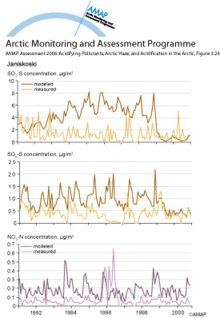
Time series of measured and modeled monthly concentrations of sulfur dioxide, sulfate, and nitrate at JaniskoskiTime series of measured and modeled monthly concentrations of sulfur dioxide, sulfate, and nitrate at Janiskoski, Russia |
|
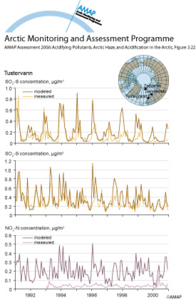
Time series of measured and modeled monthly concentrations of sulfur dioxide, sulfate, and nitrate at Tustervann , NorwayTime series of measured and modeled monthly concentrations of sulfur dioxide, sulfate, and nitrate at Tustervann , Norway |
|
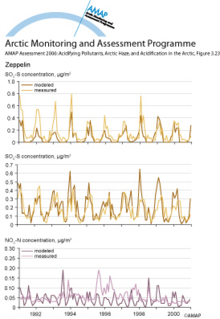
Time series of measured and modeled monthly concentrations of sulfur dioxide, sulfate, and nitrate at ZeppelinTime series of measured and modeled monthly concentrations of sulfur dioxide, sulfate, and nitrate at Zeppelin, Spitsbergen |
|
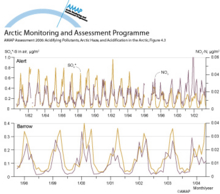
Time series of monthly averaged particulate sulfate and nitrate concentrations at Alert and BarrowTime series of monthly averaged particulate sulfate and nitrate concentrations at Alert (Canada) and Barrow (Alaska) |
|
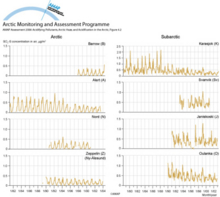
Time series of monthly averaged particulate sulfate concentrations at eight arctic monitoring sitesTime series of monthly averaged particulate sulfate concentrations at eight arctic monitoring sites |
|
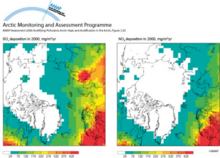
Total deposition of sulfur oxidesTotal deposition of sulfur oxides (i.e., sulfur dioxide plus sulfate) and nitrate in 2000 |
|
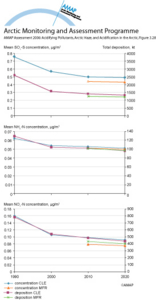
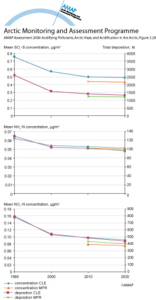
Total mean concentrations and total depositions of sulfur oxides, reduced nitrogen and airborne oxidized nitrogenTotal mean concentrations and total depositions of sulfur oxides, reduced nitrogen (NHX) and airborne oxidized nitrogen (NOy) for the area north of Arctic Circle for six emissions scenarios |
|
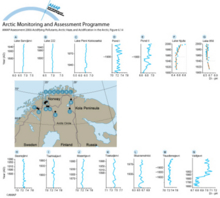
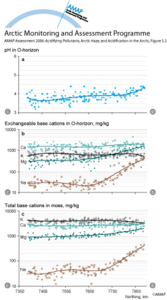
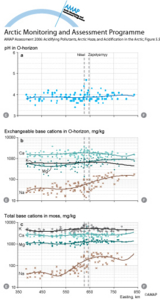
Transect south–north across the survey area near the western boundary in 1995Transect south–north across the survey area near the western boundary in 1995 (C–D on Figure 5.2), showing: (a) pH in a water extract of the O-horizon; (b) ammonium acetate extractable (pH 4.5) base [..] |
|
Transect south–north across the survey area near the western boundary in 1995Transect south–north across the survey area near the western boundary in 1995, showing: (a) pH in a water extract of the O-horizon; (b) ammonium acetate extractable (pH 4.5) base cation concentrations [..] |

|
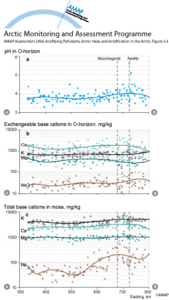
Transect west–east across the survey area and through the industrial zone centered on Monchegorsk and Apatity in 1995Transect west–east across the survey area and through the industrial zone centered on Monchegorsk and Apatity in 1995, showing: (a) pH in a water extract of the O-horizon of podzol soils; (b) [..] |
|
Transect west–east across the survey area and through the industrial zone centered on Nikel and Zapolyarnyy in 1995Transect west–east across the survey area and through the industrial zone centered on Nikel and Zapolyarnyy in 1995, showing (a) pH in a water extract of the O-horizon of podzol soils; (b) [..] |
|
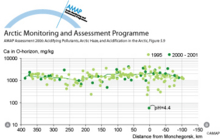
Transect west–east across the survey area showing exchangeable Ca in the O-horizon of podzol soils in 1995 and from 2000 to 2001Transect west–east across the survey area showing exchangeable Ca in the O-horizon of podzol soils in 1995 (Kola Ecogeochemistry Project) and from 2000 to 2001 (Barents Ecogeochemistry Project) |
|
Trends in non-marine sulfate, alkalinity, non-marine base cations, and pHTrends in non-marine sulfate, alkalinity, non-marine base cations, and pH for lakes on the Kola Peninsula |
|
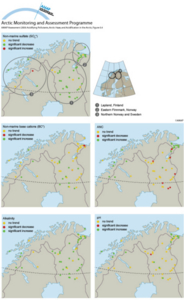
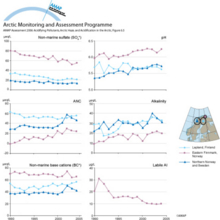
Trends in non-marine sulfate, non-marine base cations, alkalinity, acid neutralizing capacity, and pHTrends in non-marine sulfate, non-marine base cations (Ca+Mg), alkalinity, acid neutralizing capacity, and pH across the Euro-Arctic Barents region for 1990 to 2004. Large circles denote the three [..] |
|
Trends in non-marine sulfate, non-marine base cations, alkalinity, acid neutralizing capacity, pH, and labile aluminumTrends in non-marine sulfate, non-marine base cations, alkalinity, acid neutralizing capacity, pH, and labile aluminum for lakes in the three sub-regions |
|
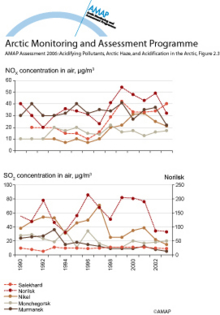
Trends in NOx and SO2 concentrationsTrends in NOx and SO2 concentrations in air in various cities in the Russian Arctic |
|
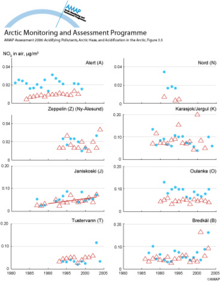
Trends in summer and winter nitrate concentrations in air within the ArcticTrends in summer and winter nitrate concentrations in air within the Arctic |
|
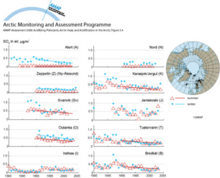
Trends in summer and winter total sulfate concentrations in air within the ArcticTrends in summer and winter total sulfate concentrations in air within the Arctic |
|
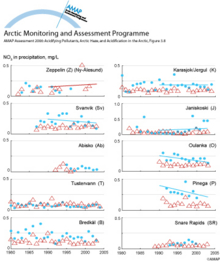
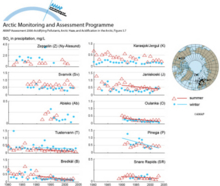
Trends in weighted summer and winter nitrate concentrations in precipitation within the ArcticTrends in weighted summer and winter nitrate concentrations in precipitation within the Arctic |
|
Trends in weighted summer and winter sulfate concentrations in precipitation within the ArcticTrends in weighted summer and winter sulfate concentrations in precipitation within the Arctic |
|
Visible (acute) SO2 injuries on (a) birch leaves and (b) Scots pine needles at SvanvikVisible (acute) SO2 injuries on (a) birch (Betula pubescens) leaves and (b) Scots pine (Pinus sylvestris) needles at Svanvik, Norway, approximately 10 km northwest of Nikel |

|
