More information and download links below the graphic.
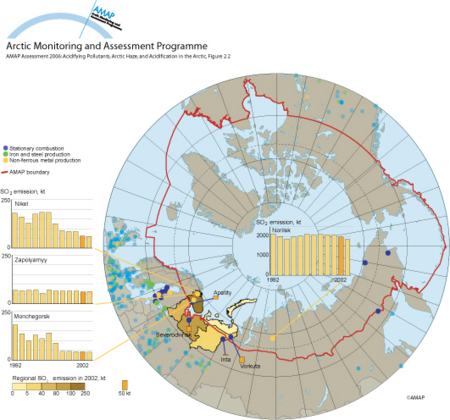
Sulfur dioxide emissions from metallurgical industry sources

Click here, or on the graphic, for full resolution.
Sulfur dioxide emissions from metallurgical industry sources and major coal-fired power plants in Russia (there are no significant point sources north of 60º N in other Arctic countries; pale coloured symbols are sources south of 60º N). Also shown are total emissions of SO2 in 2002 from the five regions of northwestern Russia. Subplots show trends in emissions from Russian non-ferrous metal smelters. Orange columns on the subplots, and on the map (for the four power plants with the largest SO2 emissions), represent emissions in 2002 (note: the scale on the Norilsk subplot is different from all other data shown)
| Sources | Sources: smelter emissions: Ministry of Natural Resources official statistics; coal-fired power plant emissions | ||||||
|
Cartographer/ Designer |
Satu Turtiainen, Erika Varkonyi, Petri Porvari, Marjut Nyman (Finnish Environmental Institute) | ||||||
| Appears in |
AMAP Assessment 2006: Acidifying Pollutants, Arctic Haze and Acidification in the Arctic |
||||||
| Published | 2009 | ||||||
| Feedback/Comment/Inquiry | Contact webmaster | ||||||
| Search for other graphics |
With related subjects Covering the same geographic area |
||||||
|
Available Downloads
(please review use constraints above) |
|
||||||
|
Citation/Reference Use constraints |
Please refer to the AMAP policy regarding use and reproduction of AMAP maps and graphics |
