Arctic Oil and Gas 2007
Publisher: Arctic Monitoring and Assessment Programme (AMAP), Publication date: 2007
Assessment of oil and gas activities in the Arctic
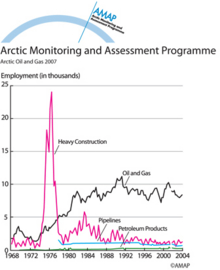
Alaska quarterly oil and gas employmentAlaska quarterly oil and gas employment, 1968-2004, showing the sharp spike in construction employment during the building of the Alaska Pipeline in the mid-1970s followed by more stable, but lower, [..] |
|
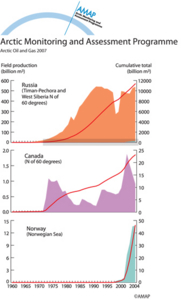
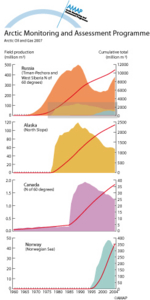
Annual and cumulative gas production in arctic areas, by countryAnnual and cumulative gas production in arctic areas, by country Note: Scales on the graphs differ considerably. For comparison, the upper graphs (Russia) also include the production curves for [..] |
|
Annual and cumulative oil production in arctic areas, by countryAnnual and cumulative oil production in arctic areas, by country. Note: Scales on the graphs differ considerably. For comparison, the upper graphs (Russia) also include the production curves for other [..] |
|
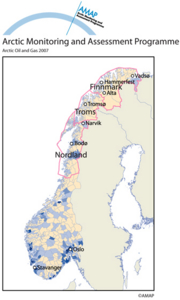
Distribution of business activity around Norway from oil and gasDistribution of business activity around Norway from oil and gas, shown in relative levels of spending by area |
|
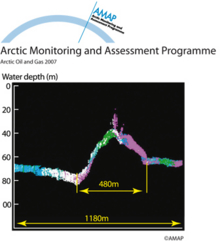
Echo sounder crosssection of the Kopanoar mud volcano with methane venting from crestEcho sounder crosssection of the Kopanoar mud volcano with methane venting from crest, central Canadian Beaufort Shelf |
|
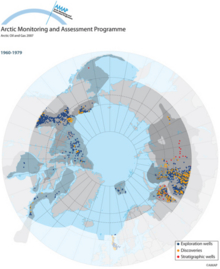
Expansion of exploration drilling activity in arctic oil and gas provinces. Locations of drilling 1960 to 1979Expansion of exploration drilling activity in arctic oil and gas provinces. Locations of drilling 1960 to 1979 |
|
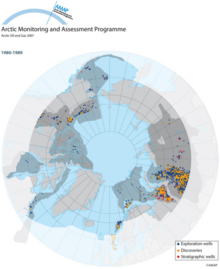
Expansion of exploration drilling activity in arctic oil and gas provinces. Locations of drilling 1980 to 1989Expansion of exploration drilling activity in arctic oil and gas provinces. Locations of drilling 1980 to 1989 |
|
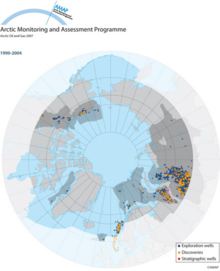
Expansion of exploration drilling activity in arctic oil and gas provinces. Locations of drilling 1990 to 2004Expansion of exploration drilling activity in arctic oil and gas provinces. Locations of drilling 1990 to 2004 |
|
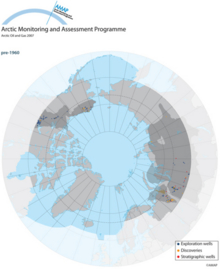
Expansion of exploration drilling activity in arctic oil and gas provinces. Locations of drilling pre 1960Expansion of exploration drilling activity in arctic oil and gas provinces. Locations of drilling pre 1960 |
|
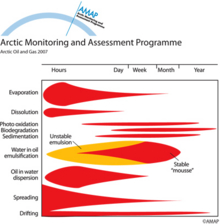
Fate of spilled oil - the most important weathering processes and their time windowsFate of spilled oil - the most important weathering processes and their time windows |
|
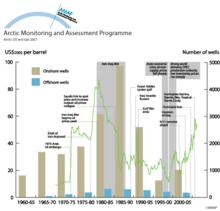
Fluctuations in the price of oilFluctuations in the price of oil (adjusted to 2005 dollar equivalents), showing response to World events, and numbers of exploration wells drilled onshore and offshore in different 5-year intervals. |
|
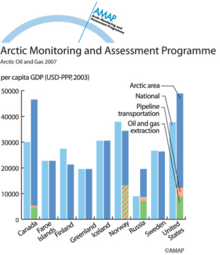
GDP in Arctic regions compared with national averagesGDP in Arctic regions compared with national averages (2002), showing the contribution of oil and gas extraction and pipeline transport to the regional GDP |
|
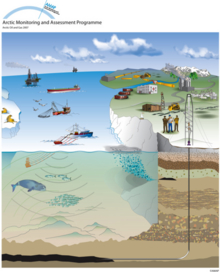
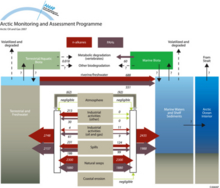
Generalized schematic diagram of oil and gas activitiesGeneralized schematic diagram of oil and gas activities |
|
Holistic approach to assessment of health of the general populationHolistic approach to assessment of health of the general population |
|
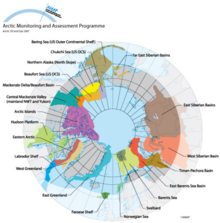
Major Oil and Gas Provinces and basins around the ArcticMajor Oil and Gas Provinces (OGP) and basins around the Arctic |
|
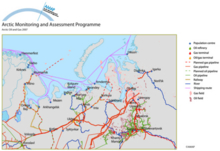
Map of main oil and gas transport routes from Russian Arctic production areasMap of main oil and gas transport routes from Russian Arctic production areas |
|
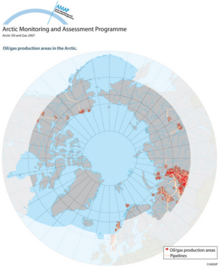
Oil/gas production areas in the ArcticOil/gas production areas in the Arctic |
|
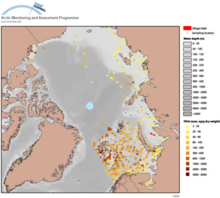
PAH concentration in bottom sediments around the Arctic, 2001-2005PAH concentration (ng/g dry weight) in bottom sediments around the Arctic, 2001-2005. Data are from various sources compiled by AMAP for this assessment. |
|
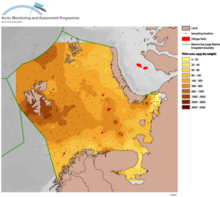
PAH concentration in bottom sediments of the Barents SeaPAH concentration (ng/g dry weight) in bottom sediments of the Barents Sea. Fine structure and hot spots shown on interpolated maps, such as this, should be viewed with caution, however the general [..] |
|
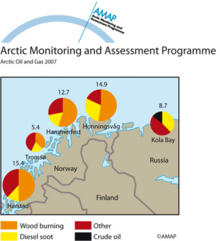
PAH contamination in bottom sediments from harbours in northern Norway and RussiaPAH contamination (mg/kg dry weight) in bottom sediments from harbours in northern Norway and Russia, showing the contributions from various sources |
|
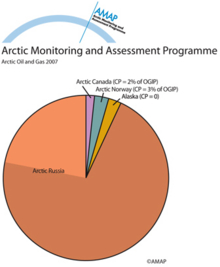
Pie charts showing original gas in place in the Arctic areas of the four Arctic producing countriesPie charts showing original gas in place (OGIP) in the Arctic areas of the four Arctic producing countries, and the cumulative production to date (part indicated by lighter shading, or %) |
|
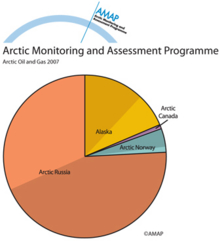
Pie charts showing original oil in place in the Arctic areas of the four Arctic producing countriesPie charts showing original oil in place (OOIP) in the Arctic areas of the four Arctic producing countries, and the cumulative production to date (part indicated by lighter shading, or %) |
|
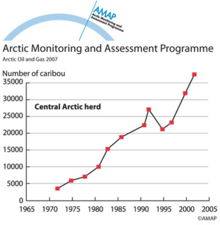
Population changes over time in the Central Arctic caribou herd, AlaskaPopulation changes over time in the Central Arctic caribou herd, Alaska |
|
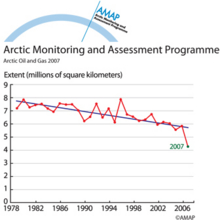
Recent observations of summer sea-ice extentRecent observations of summer sea-ice extent |
|
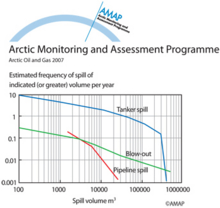
Relationship between frequency and volume of releases to the marine environment from different sources (worldwide)Relationship between frequency and volume of releases to the marine environment from different sources (worldwide) |
|
Schematic diagram of the petroleum hydrocarbon budget of the ArcticSchematic diagram of the petroleum hydrocarbon budget of the Arctic; inputs via the atmosphere are primarily non-petrogenic. Units: tonnes per year |
|
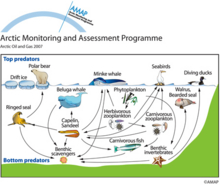
Simplified Barents Sea food-webThe Barents Sea is moderately productive, but being large, it supports large fish populations. Walrus, bowheads and other large whales were seriously depleted by this previous hunting, and have been [..] |
|
