More information and download links below the graphic.
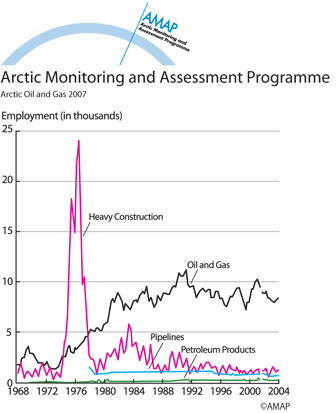
Alaska quarterly oil and gas employment

Alaska quarterly oil and gas employment, 1968-2004, showing the sharp spike in construction employment during the building of the Alaska Pipeline in the mid-1970s followed by more stable, but lower, employment during the production phase
| Sources | AMAP | ||||
|
Cartographer/ Designer |
John Bellamy | ||||
| Appears in |
Arctic Oil and Gas 2007 |
||||
| Published | 2010 | ||||
| Feedback/Comment/Inquiry | Contact webmaster | ||||
| Search for other graphics |
With related subjects Covering the same geographic area |
||||
|
Available Downloads
(please review use constraints above) |
|
||||
|
Citation/Reference Use constraints |
Please refer to the AMAP policy regarding use and reproduction of AMAP maps and graphics |
