Your query returned 168 graphics.
Results 16 - 30
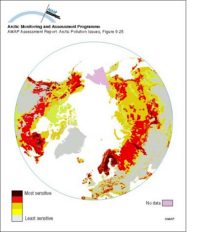
Sensitivity of Arctic ecosystems to acid depositionSensitivity of Arctic ecosystems to acid deposition |
|
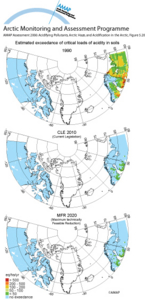
Estimated exceedance of critical loads of acidity for soils for three emission/deposition scenariosEstimated exceedance of critical loads of acidity for soils for three emission/deposition scenarios: 1990 emissions, the CLE scenario for 2010 (CLE, 2010), and the MFR scenario for 2020 (MFR, 2020). |
|
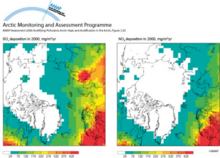
Total deposition of sulfur oxidesTotal deposition of sulfur oxides (i.e., sulfur dioxide plus sulfate) and nitrate in 2000 |
|
Spatial trends in the net flux from reindeer meat in different Arctic areas, for the first year after an assumed uniform deposition of 100 kBq/m2Spatial trends in the net flux from reindeer meat in different Arctic areas, for the first year after an assumed uniform deposition of 100 kBq/m2 |

|
Comparison of the predicted flux of 137Cs in milk and reindeer meat in different Arctic areas, for the first year after an assumed uniform deposition of 100 kBq/m2Comparison of the predicted flux of 137Cs in milk and reindeer meat in different Arctic areas, for the first year after an assumed uniform deposition of 100 kBq/m2 |

|
Relative 137Cs output in foodstuffs from the different Arctic Norwegian counties in the first year after an assumed uniform deposition of 100 kBq/m2Relative 137Cs output in foodstuffs from the different Arctic Norwegian counties in the first year after an assumed uniform deposition of 100 kBq/m2 |

|
The comparative importance of different foodstuffs as sources of 137Cs for the three Arctic Norwegian counties over the 1-year and 50-year period following an assumed uniform deposition of 100 kBq/m2The comparative importance of different foodstuffs as sources of 137Cs for the three Arctic Norwegian counties over the 1-year and 50-year period following an assumed uniform deposition of 100 kBq/m2 |

|
(a) Critical deposition of sulfur, and (b) its exceedance, in forest soils of northern Europe and Russia (5th percentile of the calculation points in each EMEP grid cell)(a) Critical deposition of sulfur, and (b) its exceedance, in forest soils of northern Europe and Russia (5th percentile of the calculation points in each EMEP grid cell) |

|
(a) Critical loads of acidity expressed as sulfur (5th percentile presented for each grid) for lakes in northern Fennoscandia and surface waters on Svalbard, and (b) their exceedance (95th percentile)(a) Critical loads of acidity expressed as sulfur (5th percentile presented for each grid) for lakes in northern Fennoscandia and surface waters on Svalbard, and (b) their exceedance (95th percentile) |

|
Vertical distribution of Arctic haze in summer, winter, and the whole year Sulfur air concentrations and relative source-contribution (%) for different heights above the ground are shown The concentrations are averages over the Arctic area north of 70°NVertical distribution of Arctic haze in summer, winter, and the whole year Sulfur air concentrations and relative source-contribution (%) for different heights above the ground are shown The [..] |

|
Development of a type 1 ozone anomaly The series of satellite images show total column ozone for a period of days spanning 6-26 January 1996Development of a type 1 ozone anomaly The series of satellite images show total column ozone for a period of days spanning 6-26 January 1996 |

|
Trends in (annual average) ozone mixing ratio over Canada from 1980 to 1993Trends in (annual average) ozone mixing ratio over Canada from 1980 to 1993 |

|
Ozone soundings at Gardermoen, southern Norway, 27 January 1992 The green line denotes the partial pressure of ozone observed during the (type 1) anomaly, when low-ozone air passed over the areaOzone soundings at Gardermoen, southern Norway, 27 January 1992 The green line denotes the partial pressure of ozone observed during the (type 1) anomaly, when low-ozone air passed over the area |

|
An example of a type 2 ozone anomaly, showing levels of ozone depletion relative to the long-term meanAn example of a type 2 ozone anomaly, showing levels of ozone depletion relative to the long-term mean |

|
Ozone soundings at Sodankylä, Finland, 23 March 1995 The green line denotes the profile of partial pressure of ozone observed during the (type 2) anomaly The red line shows the monthly mean ozone profile for MarchOzone soundings at Sodankylä, Finland, 23 March 1995 The green line denotes the profile of partial pressure of ozone observed during the (type 2) anomaly The red line shows the monthly mean ozone [..] |

|

water OR waste searches for either of these words
oceans AND biodiversity searches for blocks with both words
pollution NEAR water searches for blocks with either of these words, with them being closer ranks higher
"climate change" searches for this phrase