More information and download links below the graphic.
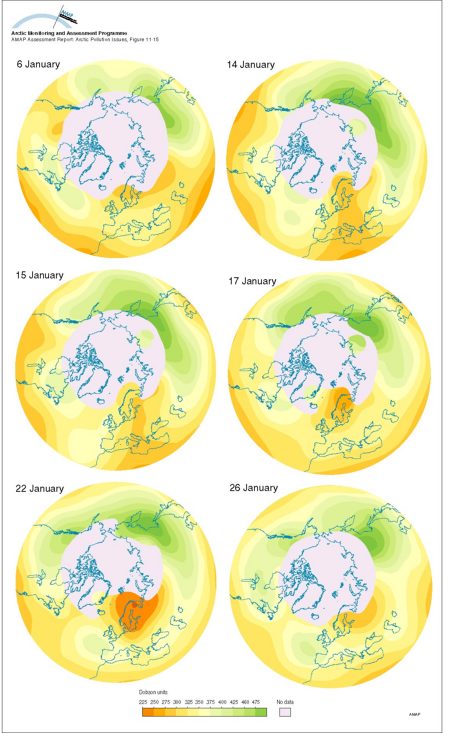
Development of a type 1 ozone anomaly The series of satellite images show total column ozone for a period of days spanning 6-26 January 1996

Click here, or on the graphic, for full resolution.
Development of a type 1 ozone anomaly The series of satellite images show total column ozone for a period of days spanning 6-26 January 1996
| Sources | Title (cont.) The anomaly was primarily caused by the dynamic atmospheric circulation, and then augumented by chemical reactions. January 6: a ‘normal’ Arctic image with typically higher ozone (green colours) nearer the pole and an assymetric distribution around the pole due to the unstable polar vortex. January 14-15: show the insurgence of lower-ozone air (orange colours) from mid-latitudes coming northward over central Europe. January 17: the migrated low-ozone air is isolated by the polar vortex. January 22: the ozone concentration within this isolated air mass (most visible over Scandinavia) is lowered to approximately 200 Dobson units, presumably due to chemical destruction. January 26: shows the dissolution of this ozone event after a few days. (Source of data: SBUV-2 on Nimbus 14). (AAR Figure 11.15) | ||||
|
Cartographer/ Designer |
Graphical production: Philippe Rekacewicz and Emmanuelle Bournay (GRID-Arendal) | ||||
| Appears in |
AMAP Assessment Report: Arctic Pollution Issues |
||||
| Published | 1998 | ||||
| Feedback/Comment/Inquiry | Contact webmaster | ||||
| Search for other graphics |
With related subjects Covering the same geographic area |
||||
|
Available Downloads
(please review use constraints above) |
|
||||
|
Citation/Reference Use constraints |
Please refer to the AMAP policy regarding use and reproduction of AMAP maps and graphics |
