AMAP Assessment Report: Arctic Pollution Issues
Publisher: Arctic Monitoring and Assessment Programme (AMAP), Publication date: 1998
, Published in series:
AMAP Assessments
AMAP 1998. AMAP Assessment Report: Arctic Pollution Issues. Arctic Monitoring and Assessment Programme (AMAP), Oslo, Norway. Xii+859 pp.
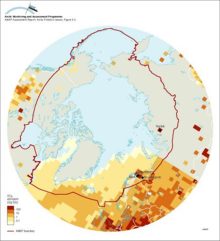
(a) Critical deposition of sulfur, and (b) its exceedance, in forest soils of northern Europe and Russia (5th percentile of the calculation points in each EMEP grid cell)(a) Critical deposition of sulfur, and (b) its exceedance, in forest soils of northern Europe and Russia (5th percentile of the calculation points in each EMEP grid cell) |

|
(a) Critical loads of acidity expressed as sulfur (5th percentile presented for each grid) for lakes in northern Fennoscandia and surface waters on Svalbard, and (b) their exceedance (95th percentile)(a) Critical loads of acidity expressed as sulfur (5th percentile presented for each grid) for lakes in northern Fennoscandia and surface waters on Svalbard, and (b) their exceedance (95th percentile) |

|
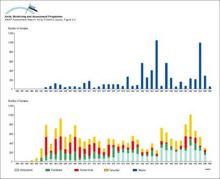
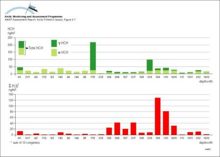
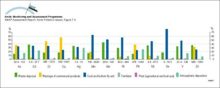
(a) The contribution from the different sources to the total deposition, averaged over the area north of 75°N from October 1990 to May 1994, (b) the calculated total monthly depositions of SOx averaged over the area north of 75°N, and (c) the(a) The contribution from the different sources to the total deposition, averaged over the area north of 75°N from October 1990 to May 1994, (b) the calculated total monthly depositions of SOx [..] |

|
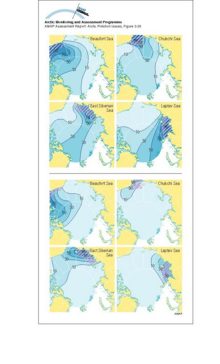
(a) Trajectories of five satellite-tracked buoys launched in Mackenzie Bay, Canada, and (b) results of 30-day trajectories of oil launched from five hypothetical spill locations in the Beaufort Sea(a) Trajectories of five satellite-tracked buoys launched in Mackenzie Bay, Canada, and (b) results of 30-day trajectories of oil launched from five hypothetical spill locations in the Beaufort Sea |

|
(a) Vertical distribution of SOx (SO2 + SO42-) concentrations averaged over the area north of 75°N, and (b) contributions from the different sources(a) Vertical distribution of SOx (SO2 + SO42-) concentrations averaged over the area north of 75°N, and (b) contributions from the different sources |

|
(a) Yearly average sulfur dioxide air concentration measurements in the Arctic, (b) Yearly average sulfate air concentration measurements in the Arctic(a) Yearly average sulfur dioxide air concentration measurements in the Arctic, (b) Yearly average sulfate air concentration measurements in the Arctic |
|
A comparison of the structures of the Bergen, Toronto, and Combined zonally-averaged global modelsA comparison of the structures of the Bergen, Toronto, and Combined zonally-averaged global models |

|
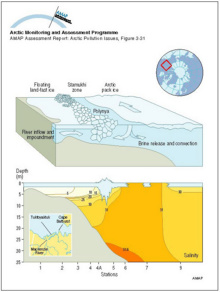
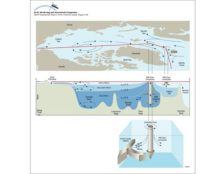
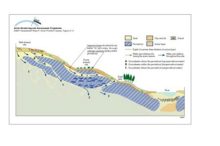
A schematic diagram showing the inflow from the Mackenzie River trapped in the nearshore zone beneath the landfast ice Beyond the stamukhi zone, intermittent opening and refreezing in the flaw lead produces brine which encourages mixing and convectionA schematic diagram showing the inflow from the Mackenzie River trapped in the nearshore zone beneath the landfast ice Beyond the stamukhi zone, intermittent opening and refreezing in the flaw lead [..] |
|
A schematic of the three-level thermodynamic snow ice system modelA schematic of the three-level thermodynamic snow ice system model |
|
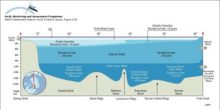
A schematic representation of the three-layer structure of the Arctic Ocean, with the Arctic Surface Layer above the Atlantic Water and Arctic Deep Water The residence time for the different water masses are also shownA schematic representation of the three-layer structure of the Arctic Ocean, with the Arctic Surface Layer above the Atlantic Water and Arctic Deep Water The residence time for the different water [..] |
|
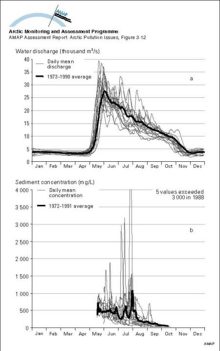
a) The annual (1973-1990) and mean annual hydrographs for the Mackenzie River above the Arctic Red River, NWT, Canada, indicating the dominance of the spring freshet in Maya) The annual (1973-1990) and mean annual hydrographs for the Mackenzie River above the Arctic Red River, NWT, Canada, indicating the dominance of the spring freshet in May |
|
Above: contours of the asymptotic probability of ice formed in the hatched region moving into different parts of the Arctic Basin Below: contours of the asymptotic probability of ice moving from different areas into the hatched region and meltingAbove: contours of the asymptotic probability of ice formed in the hatched region moving into different parts of the Arctic Basin Below: contours of the asymptotic probability of ice moving from [..] |
|
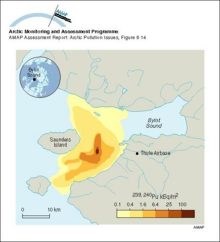
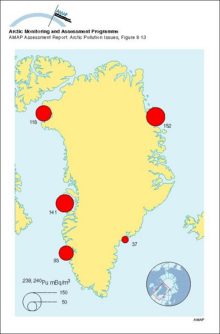
Activity concentrations of 239,240Pu in sediments near Thule, GreenlandActivity concentrations of 239,240Pu in sediments near Thule, Greenland |
|
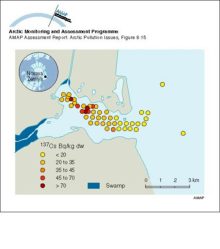
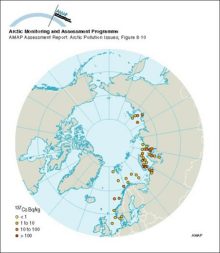
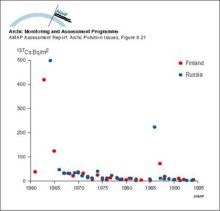
Activity concentrations of 137Cs in sediments of Abrosimov BayActivity concentrations of 137Cs in sediments of Abrosimov Bay |
|
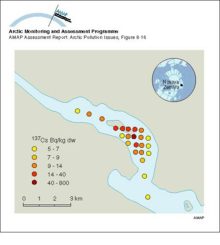
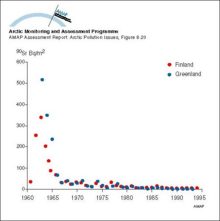
Activity concentrations of 137Cs in sediments of Stepovogo BayActivity concentrations of 137Cs in sediments of Stepovogo Bay |
|
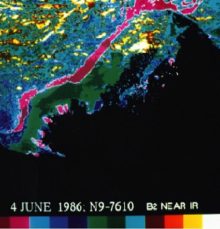
Advanced Very High Resolution Radiometer (AVHRR) satellite image (June 4, 1986) showing a color composite of the visible data band for the Mackenzie Delta River water overflowing the landfast ice can be seen as purple regionsAdvanced Very High Resolution Radiometer (AVHRR) satellite image (June 4, 1986) showing a color composite of the visible data band for the Mackenzie Delta River water overflowing the landfast ice can [..] |
|
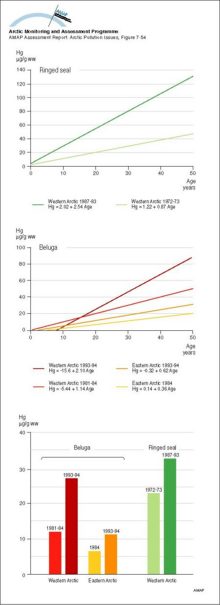
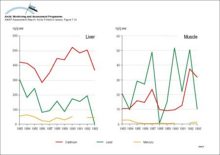
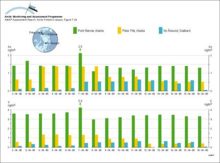
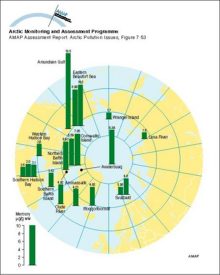
Age accumulation and temporal comparison of mean concentrations of Hg in liver tissue of ringed seal (Phoca hispida) and beluga whale (Delphinapterus leucas) fron the Canadian ArcticAge accumulation and temporal comparison of mean concentrations of Hg in liver tissue of ringed seal (Phoca hispida) and beluga whale (Delphinapterus leucas) fron the Canadian Arctic |
|
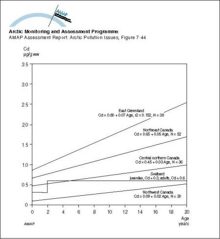
Age accumulation of Cd in liver of polar bears from different Arctic regionsAge accumulation of Cd in liver of polar bears from different Arctic regions |
|
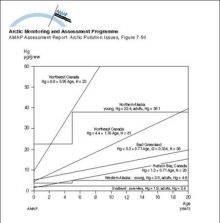
Age accumulation of Hg in liver of polar bears from different Arctic regionsAge accumulation of Hg in liver of polar bears from different Arctic regions |
|
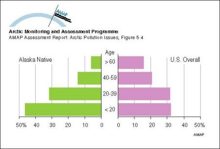
Age structure of Alaska indigenous, Alaska total, and United States total populations, 1980Age structure of Alaska indigenous, Alaska total, and United States total populations, 1980 |
|
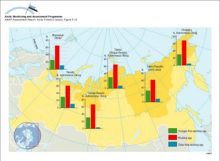
Age structure of the Arctic population of the Russian Federation, % of the total population, by region, 1993Age structure of the Arctic population of the Russian Federation, % of the total population, by region, 1993 |
|
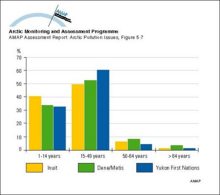
Age structure of the indigenous population of Arctic Canada, by ethnicityAge structure of the indigenous population of Arctic Canada, by ethnicity |
|
AHH induction in lake trout from CanadaAHH induction in lake trout from Canada |
|
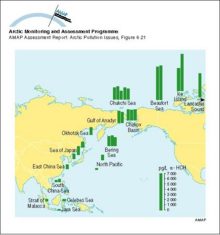
alpha-HCH (ng/L) in seawater: an illustration of the cold condensation effectalpha-HCH (ng/L) in seawater: an illustration of the cold condensation effect |
|
An example of a positive feedback loop Warming leads to a decrease in sea ice cover which in turn leads to a decrease in albedo over the ocean, the result of which is further warming and further decreases in the sea ice coverAn example of a positive feedback loop Warming leads to a decrease in sea ice cover which in turn leads to a decrease in albedo over the ocean, the result of which is further warming and further [..] |

|
An example of a type 2 ozone anomaly, showing levels of ozone depletion relative to the long-term meanAn example of a type 2 ozone anomaly, showing levels of ozone depletion relative to the long-term mean |

|
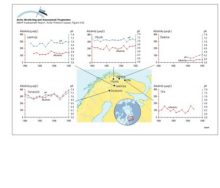
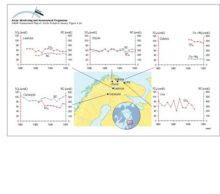
Annual average of alkalinity and pH as measured in rivers in northern Fennoscandia and the Kola PeninsulaAnnual average of alkalinity and pH as measured in rivers in northern Fennoscandia and the Kola Peninsula |
|
Annual average of sulfate and base cation concentrations as measured in rivers in northern Fennoscandia and the Kola Peninsula Note: SO4 (non-seasalt) estimated for river Utsjoki from total sulfurAnnual average of sulfate and base cation concentrations as measured in rivers in northern Fennoscandia and the Kola Peninsula Note: SO4 (non-seasalt) estimated for river Utsjoki from total sulfur |
|
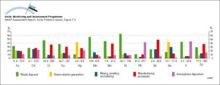
Annual indigenous subsistence production in Arctic Canada, by category, in total kg and percent of harvestAnnual indigenous subsistence production in Arctic Canada, by category, in total kg and percent of harvest |
|
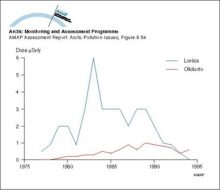
Annual radiation doses to critical groups from the Loviisa and Olkiluoto NPP’sAnnual radiation doses to critical groups from the Loviisa and Olkiluoto NPP’s |
|
Anthropogenic NOx emissions for 1985 north of 30°NAnthropogenic NOx emissions for 1985 north of 30°N |
|
Anthropogenic SO2 emissions for 1985 north of 30°NAnthropogenic SO2 emissions for 1985 north of 30°N |
|
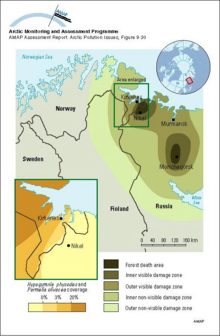
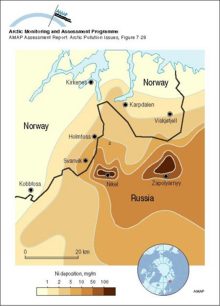
Approximate forest damage zones in the vicinity of Monchegorsk and Nikel and the visible-damage and non-visible-damage zones on the Kola Peninsula and Finnish Lapland The inset shows coverage (%) of lichens (Hypogymnia physodes and Parmelia olivacea) onApproximate forest damage zones in the vicinity of Monchegorsk and Nikel and the visible-damage and non-visible-damage zones on the Kola Peninsula and Finnish Lapland The inset shows coverage (%) of [..] |
|
Approximate net sea ice exchange (see legend for key to arrow sizes), extent of shorefast ice and winter sea ice, and coastal polynyas and main polynya concentrationsApproximate net sea ice exchange (see legend for key to arrow sizes), extent of shorefast ice and winter sea ice, and coastal polynyas and main polynya concentrations |
|
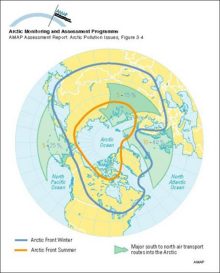
Arctic air masses and atmospheric transport routesThe mean position of the Arctic air mass in winter (January) and summer (July), superimposed on the (summer value % (orange) - winter value % (blue)) frequency of major south-to-north transport routes [..] |
|
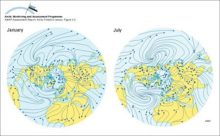
Arctic atmospheric circulationThe mean circulation of the lower atmosphere during January and July as depicted by mean streamlines of the resultant winds |
|
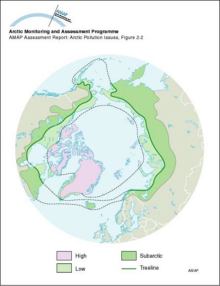
Arctic boundaries (floristic)Arctic and subarctic floristic boundaries |
|
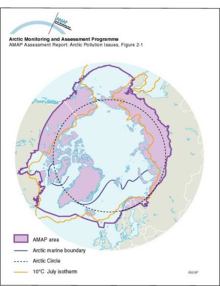
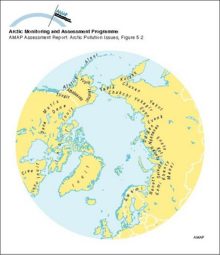
Arctic boundaries (physical)The Arctic as defined by temperature, and the Arctic marine boundary, also showing the boundary of the AMAP assessment area |
|
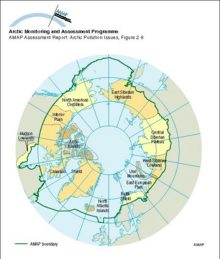
Arctic geologic and physiographic regionsGeologic and physiographic regions of the Arctic |
|
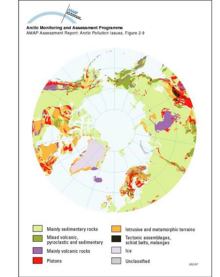
Arctic geologyBedrock geology of the Arctic |
|
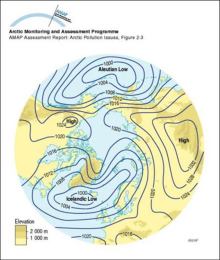
Arctic sea-level atmospheric pressure (January)Mean atmospheric sea-level pressure (mb) in the Arctic in January |
|
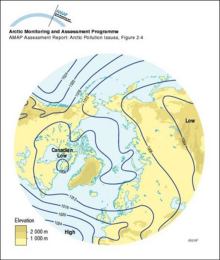
Arctic sea-level atmospheric pressure (July)Mean atmospheric sea-level pressure (mb) in the Arctic in July |
|
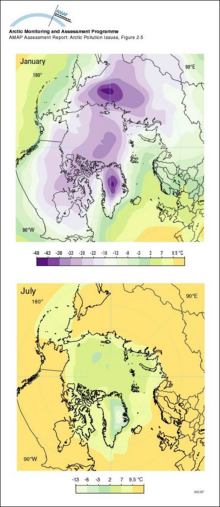
Arctic surface air temperatureMean January and July surface air temperatures (°C) in the Arctic |
|
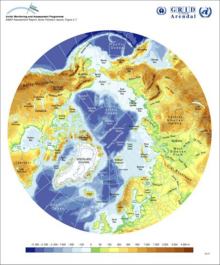
Arctic topography and bathymetryTopography and bathymetry of the Arctic (based on the ETOPO5 data set) |
|
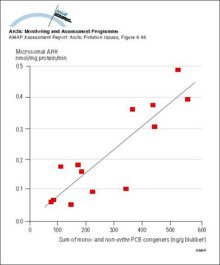
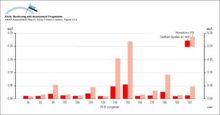
Aryl hydrocarbon hydroxylase (AHH, nmol/mg microsomal protein/min) activities in liver microsomes of beluga taken from the Eskimo Lakes area of the Mackenzie Delta, as a function of PCB congener concentrations in blubberAryl hydrocarbon hydroxylase (AHH, nmol/mg microsomal protein/min) activities in liver microsomes of beluga taken from the Eskimo Lakes area of the Mackenzie Delta, as a function of PCB congener [..] |
|
Atmosphere-surface exchangeSchematic diagram of processes of atmosphere-surface exchange |

|
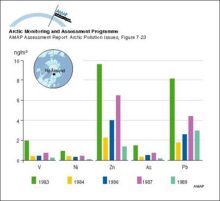
Atmospheric winter concentrations (median values) of metals measured in different years in the <25 µm aerosol fraction at Ny-Ålesund, SvalbardAtmospheric winter concentrations (median values) of metals measured in different years in the <25 µm aerosol fraction at Ny-Ålesund, Svalbard |
|
Available data in the AMAP radioactivity database as a function of timeAvailable data in the AMAP radioactivity database as a function of time |
|
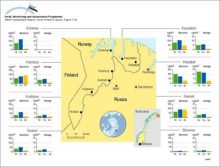
Average (15-month) and 24-h average maximum air concentrations of Ni, Cu and As measured at several stations in northern Norway near to major point sources on the Kola PeninsulaAverage (15-month) and 24-h average maximum air concentrations of Ni, Cu and As measured at several stations in northern Norway near to major point sources on the Kola Peninsula |
|
Average 137Cs activity concentrations in surface sediments of some Arctic seas sampled from 1992 to 1995Average 137Cs activity concentrations in surface sediments of some Arctic seas sampled from 1992 to 1995 |
|
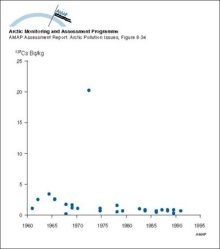
Average activity concentrations of 137Cs in reindeer meat after 1990Average activity concentrations of 137Cs in reindeer meat after 1990 |
|
Average annual maximum and minimum sea ice extent The numbered lines show the expected time in years for the ice at that location to exit the Arctic Ocean through the Fram Strait, based on drifting buoy data during 1979-1990Average annual maximum and minimum sea ice extent The numbered lines show the expected time in years for the ice at that location to exit the Arctic Ocean through the Fram Strait, based on drifting [..] |

|
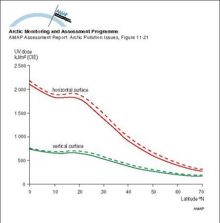
Average annual UV dose falling on vertical and horizontal surfaces as a function of latitude The solid lines represent the situation for the normal UV level with undisturbed ozone (prior to 1978)Average annual UV dose falling on vertical and horizontal surfaces as a function of latitude The solid lines represent the situation for the normal UV level with undisturbed ozone (prior to 1978) |
|
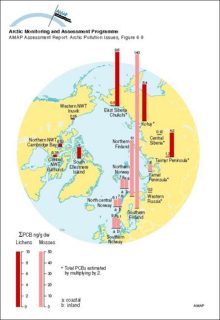
Average concentration (ng/g dw) of PCBs in Arctic lichen and mossesAverage concentration (ng/g dw) of PCBs in Arctic lichen and mosses |
|
Average concentrations (ng/L) of sum-HCH in Arctic rivers in 1993Average concentrations (ng/L) of sum-HCH in Arctic rivers in 1993 |
|
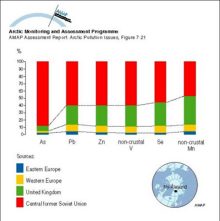
Average contributions from various sources to the atmospheric concentrations of elements in winter air samples at Ny-Ålesund, SvalbardAverage contributions from various sources to the atmospheric concentrations of elements in winter air samples at Ny-Ålesund, Svalbard |

|
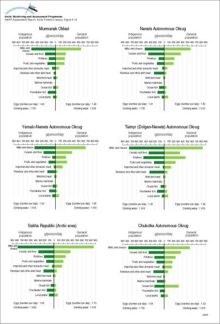
Average daily consumption of selected foods by indigenous and general populations in Arctic Russia, by region, g/person, in 1993Average daily consumption of selected foods by indigenous and general populations in Arctic Russia, by region, g/person, in 1993 |
|
Average regional source apportionment of metals in winter aerosol at Ny-Ålesund, Svalbard from Europe and the central part of the former Soviet Union (including the Urals and Norilsk)Average regional source apportionment of metals in winter aerosol at Ny-Ålesund, Svalbard from Europe and the central part of the former Soviet Union (including the Urals and Norilsk) |
|
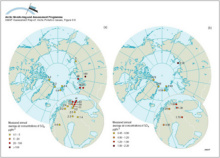
Averaged upper (3000 m) air concentrations of Pb in winter (December-February) and summer (June-August) as modeled by the updated (1996) hemispheric EMEP transport model in a simulation for the reference year 1988Averaged upper (3000 m) air concentrations of Pb in winter (December-February) and summer (June-August) as modeled by the updated (1996) hemispheric EMEP transport model in a simulation for the [..] |

|
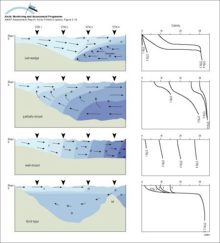
Basic circulation and salinity distribution in salt wedge, partially-mixed, well-mixed and fjord-type estuaries as defined by Wollast and Duinker (1982) Numbers and shading show salinity valuesBasic circulation and salinity distribution in salt wedge, partially-mixed, well-mixed and fjord-type estuaries as defined by Wollast and Duinker (1982) Numbers and shading show salinity values |
|
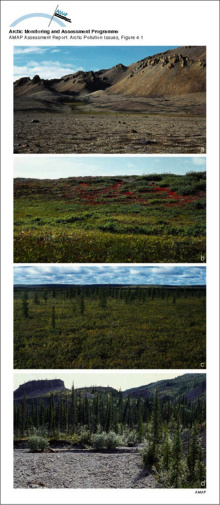
Biogeographical zones within the AMAP assessment area, a) High Arctic, b) Low Arctic, c) subarctic, and d) boreal forestBiogeographical zones within the AMAP assessment area, a) High Arctic, b) Low Arctic, c) subarctic, and d) boreal forest |
|
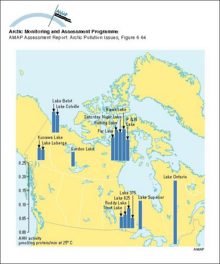
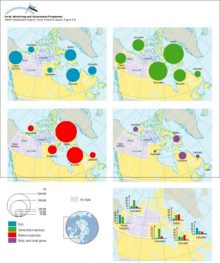
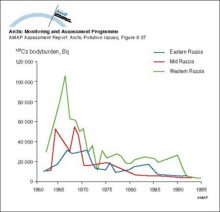
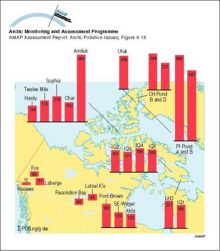
Body burdens of radiocaesium (yearly averages) across the Canadian ArcticBody burdens of radiocaesium (yearly averages) across the Canadian Arctic |

|
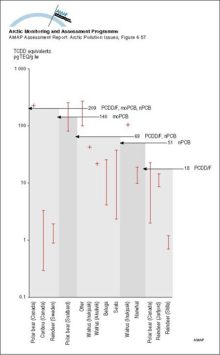
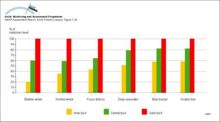
Body concentrations of PCDD/F and non-ortho and mono-ortho PCBs as TCDD equivalents (pg/g lw) in Arctic mammals compared to thresholds for immunosuppression in harbor seal for the same combinations of substances analyzedBody concentrations of PCDD/F and non-ortho and mono-ortho PCBs as TCDD equivalents (pg/g lw) in Arctic mammals compared to thresholds for immunosuppression in harbor seal for the same combinations of [..] |
|
Cadmium levels in kidney of adult marine birds from Greenland Levels associated with potential for kidney damage are above 100 µg/g wwCadmium levels in kidney of adult marine birds from Greenland Levels associated with potential for kidney damage are above 100 µg/g ww |
|
Cadmium levels in kidney of adult ringed seals from Greenland and Svalbard Levels associated with potential for kidney damage are above 100-200 µg/g wwCadmium levels in kidney of adult ringed seals from Greenland and Svalbard Levels associated with potential for kidney damage are above 100-200 µg/g ww |
|
Calculated concentrations of SO2 and SO42- compared with measurements at Station Nord in northeastern GreenlandCalculated concentrations of SO2 and SO42- compared with measurements at Station Nord in northeastern Greenland |

|
Calculated Saami population in the Arctic areas of the Saami region, by society type and regionCalculated Saami population in the Arctic areas of the Saami region, by society type and region |
|
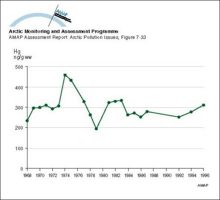
Changes with time in (weight adjusted, geometric mean) concentrations of Hg in muscle tissue of pike (Esox lucius) in SwedenChanges with time in (weight adjusted, geometric mean) concentrations of Hg in muscle tissue of pike (Esox lucius) in Sweden |
|
Changes with time in 131I activity concentration in Finnish air samplesChanges with time in 131I activity concentration in Finnish air samples |
|
Changes with time in 137Cs activity concentration in air in Norway, Finland and RussiaChanges with time in 137Cs activity concentration in air in Norway, Finland and Russia |
|
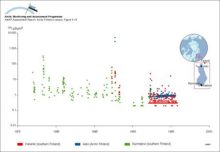
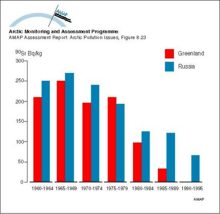
Changes with time in 137Cs activity concentration in lichen from Arctic Finland, north west Russia, and GreenlandChanges with time in 137Cs activity concentration in lichen from Arctic Finland, north west Russia, and Greenland |
|
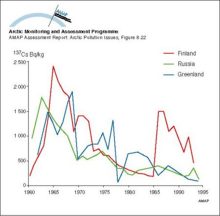
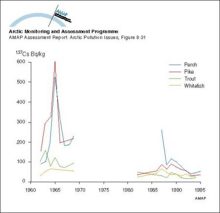
Changes with time in 137Cs activity concentration in marine fish from Greenland watersChanges with time in 137Cs activity concentration in marine fish from Greenland waters |
|
Changes with time in 137Cs activity concentration in seals from Greenland watersChanges with time in 137Cs activity concentration in seals from Greenland waters |
|
Changes with time in 137Cs activity concentration in whales from Greenland watersChanges with time in 137Cs activity concentration in whales from Greenland waters |
|
Changes with time in 137Cs activity concentrations (5-year means) in lichens in Arctic Finland, Greenland, and RussiaChanges with time in 137Cs activity concentrations (5-year means) in lichens in Arctic Finland, Greenland, and Russia |
|
Changes with time in 137Cs contamination in the food chain lichen - reindeer - humansChanges with time in 137Cs contamination in the food chain lichen - reindeer - humans |

|
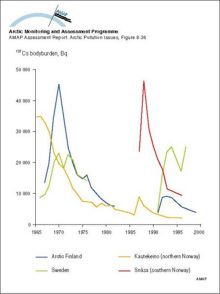
Changes with time in 137Cs wholebody measurements of reindeer herders in northern and central Norway, Arctic Finland, and SwedenChanges with time in 137Cs wholebody measurements of reindeer herders in northern and central Norway, Arctic Finland, and Sweden |
|
Changes with time in 137Cs wholebody measurements of Russian reindeer herdersChanges with time in 137Cs wholebody measurements of Russian reindeer herders |
|
Changes with time in 90Sr activity concentration (5-year means) in lichens in Greenland and RussiaChanges with time in 90Sr activity concentration (5-year means) in lichens in Greenland and Russia |
|
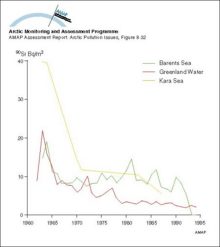
Changes with time in 90Sr activity concentrations in surface seawater from Greenland waters and the Barents and Kara SeasChanges with time in 90Sr activity concentrations in surface seawater from Greenland waters and the Barents and Kara Seas |
|
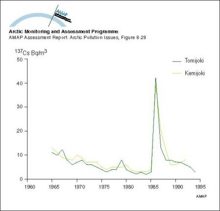
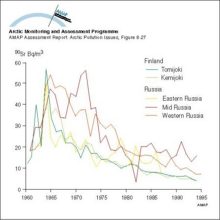
Changes with time in activity concentration of 137Cs in Finnish riversChanges with time in activity concentration of 137Cs in Finnish rivers |
|
Changes with time in activity concentration of 137Cs in freshwater fish in Arctic FinlandChanges with time in activity concentration of 137Cs in freshwater fish in Arctic Finland |
|
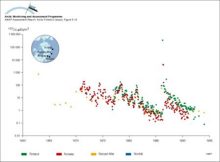
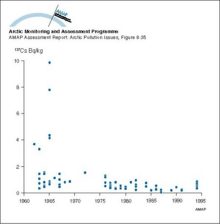
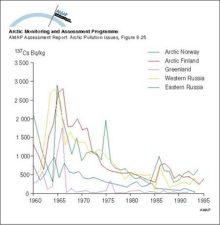
Changes with time in activity concentration of 137Cs in reindeer meat in Arctic Norway, Arctic Finland, Greenland, and Arctic RussiaChanges with time in activity concentration of 137Cs in reindeer meat in Arctic Norway, Arctic Finland, Greenland, and Arctic Russia |
|
Changes with time in activity concentration of 90Sr in Russian and Finnish riversChanges with time in activity concentration of 90Sr in Russian and Finnish rivers |
|
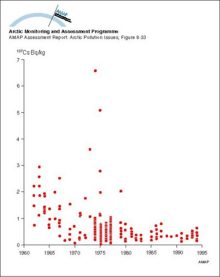
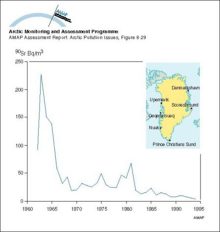
Changes with time in average activity concentration of 90Sr in drinking water in GreenlandChanges with time in average activity concentration of 90Sr in drinking water in Greenland |
|
Changes with time in concentrations of Cd, Pb and Hg in liver and muscle tissue of reindeer (Rangifer tarandus) sampled in three districts in eastern SwedenChanges with time in concentrations of Cd, Pb and Hg in liver and muscle tissue of reindeer (Rangifer tarandus) sampled in three districts in eastern Sweden |
|
Changes with time in European atmospheric emissions of Cd, Pb and ZnChanges with time in European atmospheric emissions of Cd, Pb and Zn |

|
Changes with time in wet and dry deposition of 137Cs in Arctic Finland and north west Russia (Nenets Autonomous Okrug)Changes with time in wet and dry deposition of 137Cs in Arctic Finland and north west Russia (Nenets Autonomous Okrug) |
|
Changes with time in wet and dry deposition of 90Sr in Arctic Finland and GreenlandChanges with time in wet and dry deposition of 90Sr in Arctic Finland and Greenland |
|
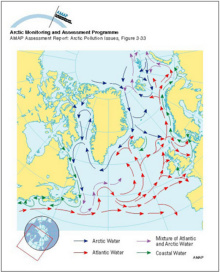
Circulation and water mass structure in the Arctic Ocean and Nordic Seas Mixing processes, such as brine formation, result in denser water that is transported off the shelves and into the deep basinCirculation and water mass structure in the Arctic Ocean and Nordic Seas Mixing processes, such as brine formation, result in denser water that is transported off the shelves and into the deep basin |
|
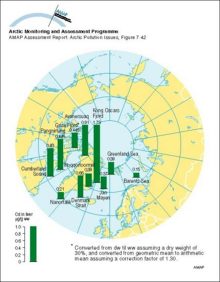
Circumpolar distribution of Cd levels in liver tissue of Arctic cod (Boreogadus saida) Arithmetic mean concentrationsCircumpolar distribution of Cd levels in liver tissue of Arctic cod (Boreogadus saida) Arithmetic mean concentrations |
|
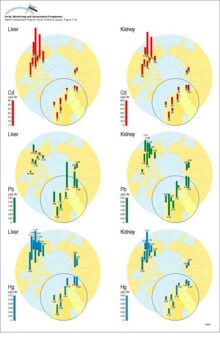
Circumpolar distribution of Cd, Pb and Hg levels in liver and kidney tissue of willow ptarmigan (Lagopus lagopus)Circumpolar distribution of Cd, Pb and Hg levels in liver and kidney tissue of willow ptarmigan (Lagopus lagopus) |
|
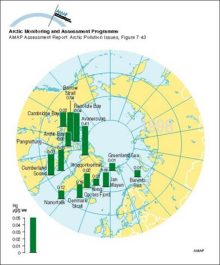
Circumpolar distribution of Hg levels in muscle tissue of Arctic cod (Boreogadus saida) Arithmetic mean concentrationsCircumpolar distribution of Hg levels in muscle tissue of Arctic cod (Boreogadus saida) Arithmetic mean concentrations |
|
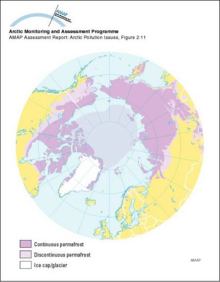
Circumpolar permafrost distributionCircumpolar permafrost distribution |
|
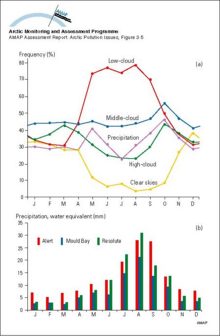
Cloud cover and precipitation in the Canadian High ArcticSeasonal variation in a) cloud cover and precipitation occurrence and b) precipitation amount in the Canadian High Arctic, 1951-1980 norms |
|
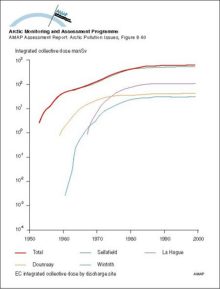
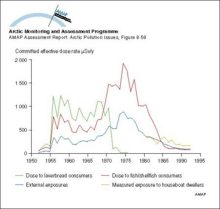
Collective dose commitment from nuclear fuel reprocessing activitiesCollective dose commitment from nuclear fuel reprocessing activities |
|
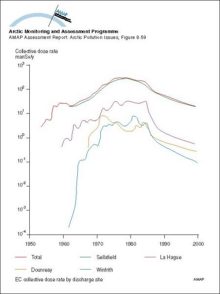
Collective dose rates from European nuclear fuel reprocessing plants based on releases up to 1986Collective dose rates from European nuclear fuel reprocessing plants based on releases up to 1986 |
|
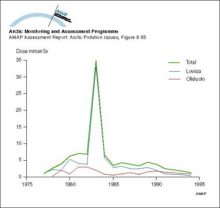
Collective doses from the Loviisa and Olkiluoto NPP’sCollective doses from the Loviisa and Olkiluoto NPP’s |
|
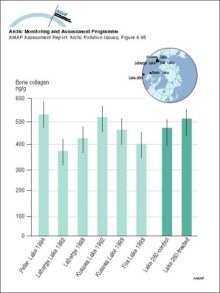
Comparison of bone collagen in lake trout from Peter Lake, NWT and from Yukon lakes, and in toxaphene- treated and control fish from Lake 260Comparison of bone collagen in lake trout from Peter Lake, NWT and from Yukon lakes, and in toxaphene- treated and control fish from Lake 260 |
|
Comparison of doses to critical groups for Sellafield discharges from 1952 to 1993Comparison of doses to critical groups for Sellafield discharges from 1952 to 1993 |
|
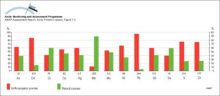
Comparison of global emissions of trace metals to the atmosphere from natural and anthropogenic sources in 1983 Numbers under the columns are the median values of estimates of total emissions in thousands of tonnes per yearComparison of global emissions of trace metals to the atmosphere from natural and anthropogenic sources in 1983 Numbers under the columns are the median values of estimates of total emissions in [..] |
|
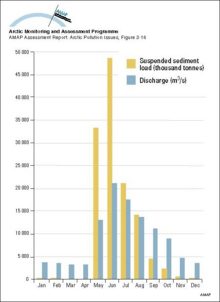
Comparison of monthly water and suspended sediment loads to the Mackenzie Delta plain for the period 1974-1983Comparison of monthly water and suspended sediment loads to the Mackenzie Delta plain for the period 1974-1983 |
|
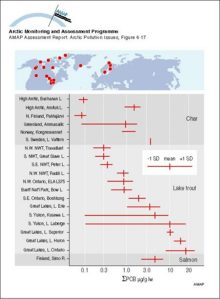
Comparison of sum-PCB concentrations (lipid normalized) in Arctic versus temperate zone salmonid fish See Annex Table 6A9 for wet weight concentrationsComparison of sum-PCB concentrations (lipid normalized) in Arctic versus temperate zone salmonid fish See Annex Table 6A9 for wet weight concentrations |
|
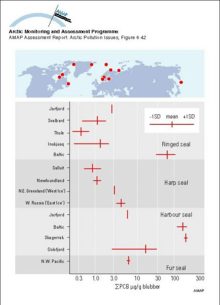
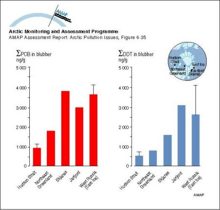
Comparison of sum-PCB concentrations in seal blubber from various Arctic regions with results from the same species in temperate waters Vertical bars represent means and the horizontal bars the standard deviation, where availableComparison of sum-PCB concentrations in seal blubber from various Arctic regions with results from the same species in temperate waters Vertical bars represent means and the horizontal bars the [..] |
|
Comparison of the predicted flux of 137Cs in milk and reindeer meat in different Arctic areas, for the first year after an assumed uniform deposition of 100 kBq/m2Comparison of the predicted flux of 137Cs in milk and reindeer meat in different Arctic areas, for the first year after an assumed uniform deposition of 100 kBq/m2 |

|
Compartment model used to assess doses from releases of radioactive materials to the atmosphere from nuclear testingCompartment model used to assess doses from releases of radioactive materials to the atmosphere from nuclear testing |
|
Composition of particles measured at different altitudes during winter flights in the Norwegian ArcticComposition of particles measured at different altitudes during winter flights in the Norwegian Arctic |

|
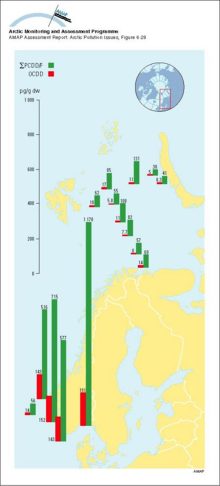
Concentration (pg/g dw) profiles for octachlorodioxin (OCDD) and total PCDD/Fs in dated sediment cores from Arctic Canada and Finland Sum-PCDD/Fs = sum of 2,3,7,8-substituted tetra- to octachloro D/Fs plus non-2,3,7,8-substituted congenersConcentration (pg/g dw) profiles for octachlorodioxin (OCDD) and total PCDD/Fs in dated sediment cores from Arctic Canada and Finland Sum-PCDD/Fs = sum of 2,3,7,8-substituted tetra- to octachloro D/Fs [..] |
|
Concentration (pg/g dw) profiles for octachlorodioxin (OCDD) and total PCDD/Fs in marine sediments from southern and western Norwegian waters and from the Barents SeaConcentration (pg/g dw) profiles for octachlorodioxin (OCDD) and total PCDD/Fs in marine sediments from southern and western Norwegian waters and from the Barents Sea |
|
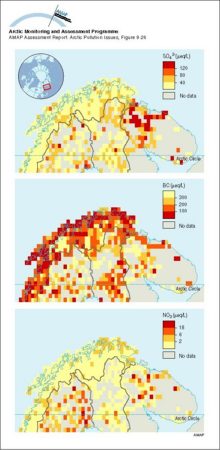
Concentrations of (a) sulfate and (b) nitrate in snowConcentrations of (a) sulfate and (b) nitrate in snow |
|
Concentrations of 239,240Pu in seawater around Greenland, 1968Concentrations of 239,240Pu in seawater around Greenland, 1968 |
|
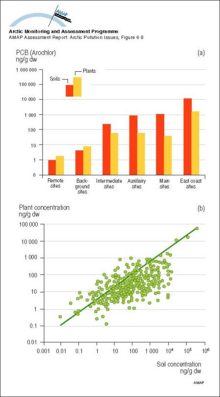
Concentrations of Aroclor PCBs in soils and plants (ng/g dw) associated with military radar sites in the Canadian Arctic a) Mean and maximum total PCB concentrations in soils and associated plants from remote (>20 km), backgroundConcentrations of Aroclor PCBs in soils and plants (ng/g dw) associated with military radar sites in the Canadian Arctic a) Mean and maximum total PCB concentrations in soils and associated plants [..] |
|
Concentrations of As and V in aerosols measured during concurrent measurement campaigns on Svalbard and two locations in Alaska during April 1986Concentrations of As and V in aerosols measured during concurrent measurement campaigns on Svalbard and two locations in Alaska during April 1986 |
|
Concentrations of Hg in Arctic marine sediment coresConcentrations of Hg in Arctic marine sediment cores |
|
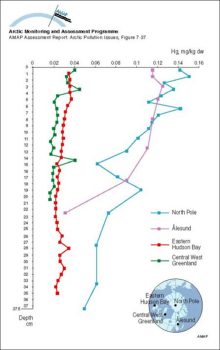
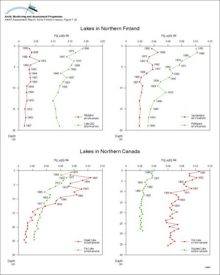
Concentrations of Hg in dated sediment cores from lakes in Arctic Finland and CanadaConcentrations of Hg in dated sediment cores from lakes in Arctic Finland and Canada |
|
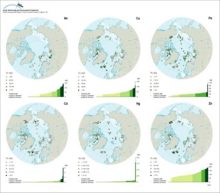
Concentrations of metals in fine-grained surface marine sediments in the ArcticConcentrations of metals in fine-grained surface marine sediments in the Arctic |
|
Concentrations of PCB congeners in cord plasma from Nunavik and southern Quebec newbornsConcentrations of PCB congeners in cord plasma from Nunavik and southern Quebec newborns |
|
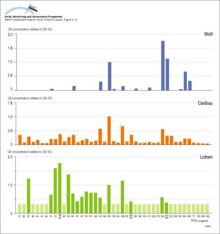
Concentrations of PCB congeners relative to PCB congener 153 for lichen, caribou, and wolf in the Bathurst herd, Canada The light bars denote that the congener was not detectedConcentrations of PCB congeners relative to PCB congener 153 for lichen, caribou, and wolf in the Bathurst herd, Canada The light bars denote that the congener was not detected |
|
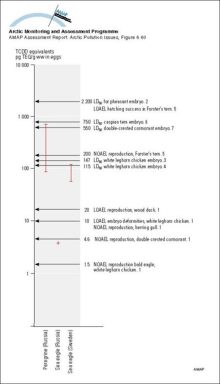
Concentrations of PCDD/F and non-ortho and mono-ortho PCBs as TCDD equivalents (pg/g ww) in Arctic bird eggs compared to thresholds for avian effects (1 Giesy et al 1994b, 2 Nosek et al 1992, 3 Verrett 1976,Concentrations of PCDD/F and non-ortho and mono-ortho PCBs as TCDD equivalents (pg/g ww) in Arctic bird eggs compared to thresholds for avian effects (1 Giesy et al 1994b, 2 Nosek et al 1992, 3 [..] |
|
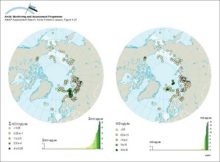
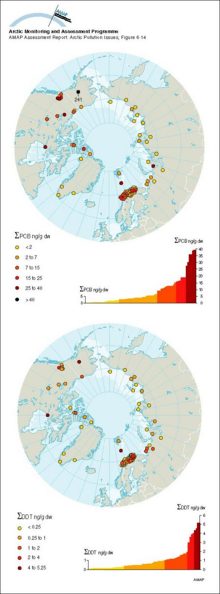
Concentrations of sum-DDT and sum-PCB in marine surface sediments (from grab samples or from top slices of cores) on a circumpolar basis, and the ranked distribution of valuesConcentrations of sum-DDT and sum-PCB in marine surface sediments (from grab samples or from top slices of cores) on a circumpolar basis, and the ranked distribution of values |
|
Concentrations of sum-HCH and HCB in marine surface sediments (from grab samples or from top slices of cores) on a circumpolar basis, and the ranked distribution of valuesConcentrations of sum-HCH and HCB in marine surface sediments (from grab samples or from top slices of cores) on a circumpolar basis, and the ranked distribution of values |
|
Concentrations of sum-HCH in Arctic airConcentrations of sum-HCH in Arctic air |

|
Concentrations of sum-PCB (µg/g ww) in Arctic bird eggs compared to thresholds for avian effects (1 Barron et al 1995, 2 Giesy et al 1994b, 3 Bosveld and Van den Berg 1994)Concentrations of sum-PCB (µg/g ww) in Arctic bird eggs compared to thresholds for avian effects (1 Barron et al 1995, 2 Giesy et al 1994b, 3 Bosveld and Van den Berg 1994) |
|
Concentrations of sum-PCB and sum-DDT in surface sediments (from grab samples or from top slices of cores) on a circumpolar basis, and the ranked distribution of valuesConcentrations of sum-PCB and sum-DDT in surface sediments (from grab samples or from top slices of cores) on a circumpolar basis, and the ranked distribution of values |
|
Concentrations of sum-PCB in Arctic air (sum of CBs 28, 31, 52, 101, 105, 118, 138, 153, 156, 180)Concentrations of sum-PCB in Arctic air (sum of CBs 28, 31, 52, 101, 105, 118, 138, 153, 156, 180) |
|
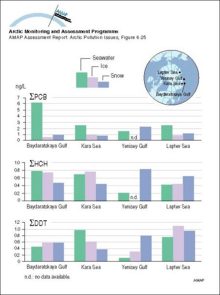
Concentrations of sum-PCB, sum-HCH, and sum-DDT in seawater, ice, and overlying snow collected at approximately the same locations in the Russian Arctic in 1993-95Concentrations of sum-PCB, sum-HCH, and sum-DDT in seawater, ice, and overlying snow collected at approximately the same locations in the Russian Arctic in 1993-95 |
|
Concentrations, as geometric means, of major organochlorine groups in burbot liver at Fort Good Hope, NWT, Canada (1986-94) Vertical bars denote standard errorsConcentrations, as geometric means, of major organochlorine groups in burbot liver at Fort Good Hope, NWT, Canada (1986-94) Vertical bars denote standard errors |

|
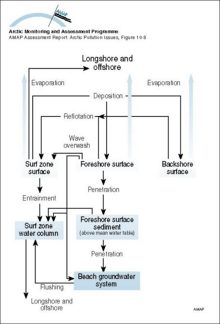
Conceptual model of the coastal zone and marine environments showing the main subcompartments and contaminant transfers, and exchanges with the atmosphereConceptual model of the coastal zone and marine environments showing the main subcompartments and contaminant transfers, and exchanges with the atmosphere |

|
Conceptual model of the terrestrial/freshwater compartment showing the main subcompartments and contaminant transfers, and exchanges with the atmosphere and oceansConceptual model of the terrestrial/freshwater compartment showing the main subcompartments and contaminant transfers, and exchanges with the atmosphere and oceans |
|
Contaminant emissions, transport and deposition in the ArcticAn illustration of the interplay between a) contaminant emissions distribution for sulfur dioxide and b) frequency of atmospheric south-to-north transport, yielding c) a net annual input of sulfur to [..] |

|
Contributions from different continents and from different sources to the global emissions of Hg to the atmosphereContributions from different continents and from different sources to the global emissions of Hg to the atmosphere |

|
Correlations between concentrations (lw) of major persistent OCs and trophic level in the marine food web for Svalbard and Lancaster Sound Trophic level data were assigned based on Hobson and Welch (1992)Correlations between concentrations (lw) of major persistent OCs and trophic level in the marine food web for Svalbard and Lancaster Sound Trophic level data were assigned based on Hobson and Welch [..] |

|
Cs-137 activity concentrations in surface seawater in 1979 and 1982Cs-137 activity concentrations in surface seawater in 1979 and 1982 |
|
Cs-137 activity concentrations in surface seawater in 1994Cs-137 activity concentrations in surface seawater in 1994 |
|
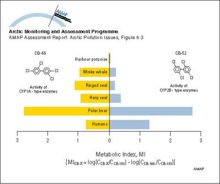
Cytochrome P450 1A (CYP1A) and cytochrome P4502B (CYP2B) type enzyme activities in some Arctic marine mammals and humans using the metabolic index (MI) suggested by Tanabe et al 1994aCytochrome P450 1A (CYP1A) and cytochrome P4502B (CYP2B) type enzyme activities in some Arctic marine mammals and humans using the metabolic index (MI) suggested by Tanabe et al 1994a |
|
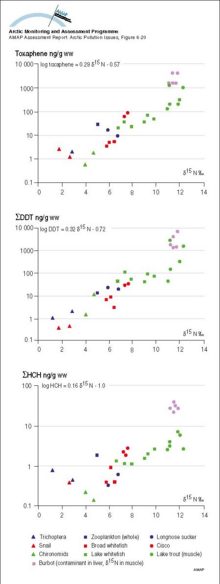
delta-15 Nitrogen isotope ratios versus Toxaphene, DDT, and HCH for fish and invertebrates from Lake Laberge, Yukon Territorydelta-15 Nitrogen isotope ratios versus Toxaphene, DDT, and HCH for fish and invertebrates from Lake Laberge, Yukon Territory |
|
Deposition of PCBs, as mono/di/trichloro- and tetra-nonachlorobiphenyls) in snow cores from the Agassiz Ice Cap (northern Ellesmere Island, Canada) Combined light and dark shaded sections of each bar indicate sum-PCB fluxDeposition of PCBs, as mono/di/trichloro- and tetra-nonachlorobiphenyls) in snow cores from the Agassiz Ice Cap (northern Ellesmere Island, Canada) Combined light and dark shaded sections of each bar [..] |

|
Development of a type 1 ozone anomaly The series of satellite images show total column ozone for a period of days spanning 6-26 January 1996Development of a type 1 ozone anomaly The series of satellite images show total column ozone for a period of days spanning 6-26 January 1996 |

|
Discharges of principle alpha emitters in liquid effluent from Sellafield, 1952-1992Discharges of principle alpha emitters in liquid effluent from Sellafield, 1952-1992 |
|
Discharges of principle beta-gamma emitters in liquid effluent from Sellafield, 1952-1992Discharges of principle beta-gamma emitters in liquid effluent from Sellafield, 1952-1992 |
|
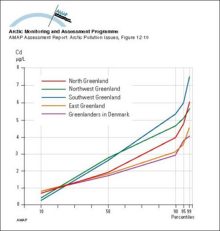
Distribution (in percentiles) of whole blood cadmium concentrations in four regions in Greenland and in Greenlanders living in DenmarkDistribution (in percentiles) of whole blood cadmium concentrations in four regions in Greenland and in Greenlanders living in Denmark |
|
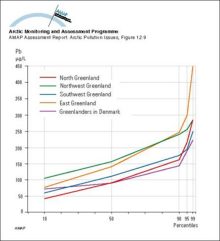
Distribution (in percentiles) of whole blood lead concentrations in four regions in Greenland and in Greenlanders living in DenmarkDistribution (in percentiles) of whole blood lead concentrations in four regions in Greenland and in Greenlanders living in Denmark |
|
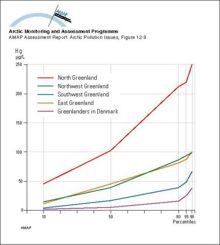
Distribution (in percentiles) of whole blood mercury concentrations in four regions in Greenland and in Greenlanders living in DenmarkDistribution (in percentiles) of whole blood mercury concentrations in four regions in Greenland and in Greenlanders living in Denmark |
|
Distribution (in percentiles) of whole blood selenium concentrations in East and North Greenland and in Greenlanders living in DenmarkDistribution (in percentiles) of whole blood selenium concentrations in East and North Greenland and in Greenlanders living in Denmark |
|
Distribution of Cd levels (age adjusted to 69 years, Svalbard adult) in liver tissue of polar bear (Ursus maritimus)Distribution of Cd levels (age adjusted to 69 years, Svalbard adult) in liver tissue of polar bear (Ursus maritimus) |
|
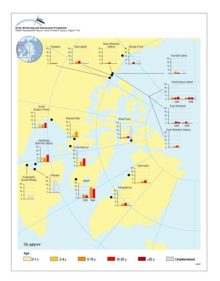
Distribution of Cd levels in liver tissue of beluga whale (Delphinapterus leucas) of different ages Plots show selected data (geometric mean values) from Annex Table 7A15Distribution of Cd levels in liver tissue of beluga whale (Delphinapterus leucas) of different ages Plots show selected data (geometric mean values) from Annex Table 7A15 |
|
Distribution of Cd levels in liver tissue of ringed seal (Phoca hispida) of different ages Plots show selected data (geometric mean values) from Annex Table 7A15Distribution of Cd levels in liver tissue of ringed seal (Phoca hispida) of different ages Plots show selected data (geometric mean values) from Annex Table 7A15 |
|
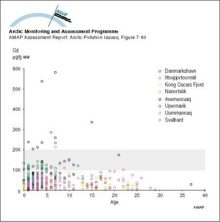
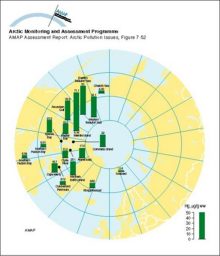
Distribution of Hg levels (age adjusted to 69 years, Svalbard adults) in liver tissue of polar bear (Ursus maritimus)Distribution of Hg levels (age adjusted to 69 years, Svalbard adults) in liver tissue of polar bear (Ursus maritimus) |
|
Distribution of Hg levels in hair of polar bear (Ursus maritimus)Distribution of Hg levels in hair of polar bear (Ursus maritimus) |
|
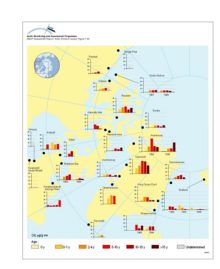
Distribution of Hg levels in liver tissue of beluga whale (Delphinapterus leucas) of different ages (years) Plots show selected data (geometric mean values) from Annex Table 7A15Distribution of Hg levels in liver tissue of beluga whale (Delphinapterus leucas) of different ages (years) Plots show selected data (geometric mean values) from Annex Table 7A15 |
|
Distribution of Hg levels in liver tissue of ringed seal (Phoca hispida) of different ages Plots show selected data (geometric mean values) from Annex Table 7A15Distribution of Hg levels in liver tissue of ringed seal (Phoca hispida) of different ages Plots show selected data (geometric mean values) from Annex Table 7A15 |
|
Distribution of organochlorine contaminants (OCs) in Arctic air, snow, seawater, and the marine mammals food chain Data for the six major classes of OCs are plotted for each compartment or species as the percent ofDistribution of organochlorine contaminants (OCs) in Arctic air, snow, seawater, and the marine mammals food chain Data for the six major classes of OCs are plotted for each compartment or species as [..] |

|
Distribution of potential temperature, salinity, and density across the Arctic Ocean and the Greenland and Norwegian SeasDistribution of potential temperature, salinity, and density across the Arctic Ocean and the Greenland and Norwegian Seas |

|
Distribution of radioactivity (PCi/L) in the surface layer of the ocean after ten years of simulation of Preller's model Source locations are the Ob, Yenisey and Pechora Rivers, as well as SellafieldDistribution of radioactivity (PCi/L) in the surface layer of the ocean after ten years of simulation of Preller's model Source locations are the Ob, Yenisey and Pechora Rivers, as well as Sellafield |
|
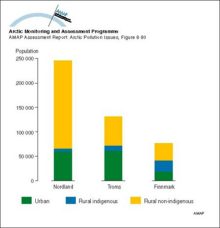
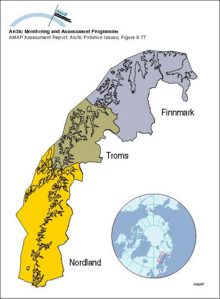
Distribution of the population of the three Arctic Norwegian countiesDistribution of the population of the three Arctic Norwegian counties |
|
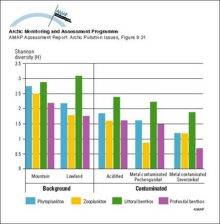
Diversity indices (Shannon-Weaver means) for phytoplankton, zooplankton and zoobenthos in lakes and streams in the Murmansk regionDiversity indices (Shannon-Weaver means) for phytoplankton, zooplankton and zoobenthos in lakes and streams in the Murmansk region |
|
Dose accumulation in adult rural residents after the Kyshtym accident in 1957Dose accumulation in adult rural residents after the Kyshtym accident in 1957 |
|
Dose estimates based on wholebody measurements (see Figure 836) for two groups (northern Saami and southern Saami) of Norwegian reindeer-breeding SaamiDose estimates based on wholebody measurements (see Figure 836) for two groups (northern Saami and southern Saami) of Norwegian reindeer-breeding Saami |

|
Educational attainments of indigenous peoples in Arctic Russia, by regionEducational attainments of indigenous peoples in Arctic Russia, by region |
|
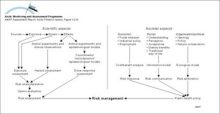
Elements involved in the evaluation and handling of risks from environmental contaminantsElements involved in the evaluation and handling of risks from environmental contaminants |
|
Emission rates of sulfur dioxide from Nikel together with annual average SO2 air concentrations measured at two sites in Norway (1978-1992)Emission rates of sulfur dioxide from Nikel together with annual average SO2 air concentrations measured at two sites in Norway (1978-1992) |

|
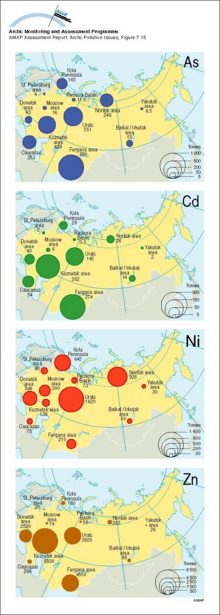
Emissions of As, Cd, Ni and Zn to the atmosphere from major sources in the former Soviet Union in 1979/80Emissions of As, Cd, Ni and Zn to the atmosphere from major sources in the former Soviet Union in 1979/80 |
|
Emissions of selected heavy metals to the atmosphere in Europe at the beginning of the 1990s Numbers under the columns are emissions in tonnes per yearEmissions of selected heavy metals to the atmosphere in Europe at the beginning of the 1990s Numbers under the columns are emissions in tonnes per year |
|
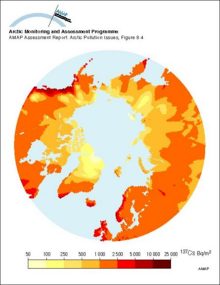
Estimated ground deposition of nuclear weapons fallout of 137Cs based on precipitation data, decay corrected to 1995Estimated ground deposition of nuclear weapons fallout of 137Cs based on precipitation data, decay corrected to 1995 |
|
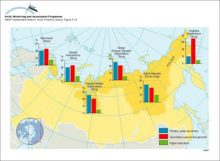
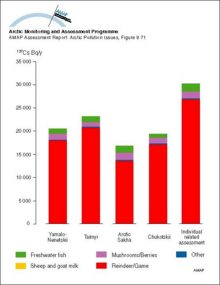
Estimated source of dietary intake of 137Cs by various indigenous population groups in different regions of Arctic Russia in 1993, and the AMAP region as a wholeEstimated source of dietary intake of 137Cs by various indigenous population groups in different regions of Arctic Russia in 1993, and the AMAP region as a whole |
|
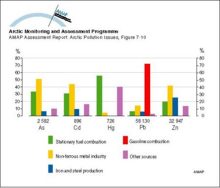
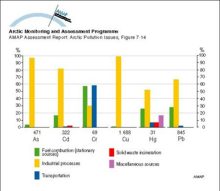
Estimates of emissions of As, Cd, Cr, Cu, Hg and Pb to the atmosphere from major source categories in Canada in 1982 Numbers under the columns are emissions in tonnes per yearEstimates of emissions of As, Cd, Cr, Cu, Hg and Pb to the atmosphere from major source categories in Canada in 1982 Numbers under the columns are emissions in tonnes per year |
|
Estimates of emissions of As, Cd, Hg and Pb to the atmosphere from major source categories in the United States Numbers under the columns are emissions in tonnes per yearEstimates of emissions of As, Cd, Hg and Pb to the atmosphere from major source categories in the United States Numbers under the columns are emissions in tonnes per year |

|
Examples of Arctic food webs, a) terrestrial, b) tundra pond, c) lake, and d) marineExamples of Arctic food webs, a) terrestrial, b) tundra pond, c) lake, and d) marine |
|
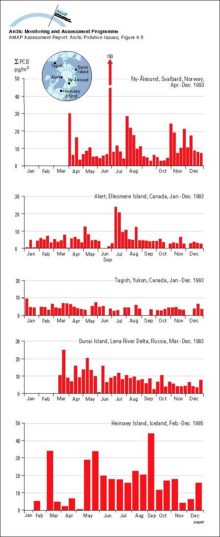
Flux of HCH and sum-PCB (sum of 10 congeners) in precipitation at Heimaey Island, IcelandFlux of HCH and sum-PCB (sum of 10 congeners) in precipitation at Heimaey Island, Iceland |
|
Frequency of consumption of food categories by Saami in Norway, percent of respondents, by society typeFrequency of consumption of food categories by Saami in Norway, percent of respondents, by society type |
|
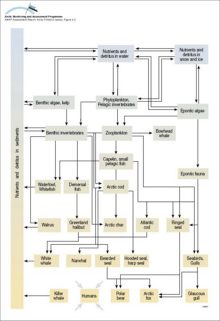
Generalized marine food webGeneralized marine food web |
|
Geographic trends of sum-PCBs in zooplankton (>100 µm) in northern Canadian lakes All concentrations in ng/g dwGeographic trends of sum-PCBs in zooplankton (>100 µm) in northern Canadian lakes All concentrations in ng/g dw |
|
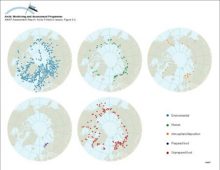
Geographical distribution of sample information in the AMAP radioactivity databaseGeographical distribution of sample information in the AMAP radioactivity database |
|
Geographical trends of PCB and DDT in harp seals from Arctic waters Vertical bars represent arithmetic means ± SD of combined results for males and females The SD has been estimated from the range in some casesGeographical trends of PCB and DDT in harp seals from Arctic waters Vertical bars represent arithmetic means ± SD of combined results for males and females The SD has been estimated from the range in [..] |
|
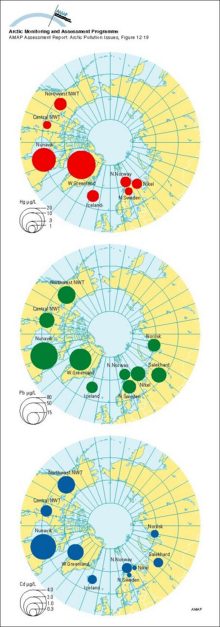
Geometric mean concentrations of mercury, lead and cadmium in maternal whole blood; AMAP circumpolar study 1994-95, see Table 12A13Geometric mean concentrations of mercury, lead and cadmium in maternal whole blood; AMAP circumpolar study 1994-95, see Table 12A13 |
|
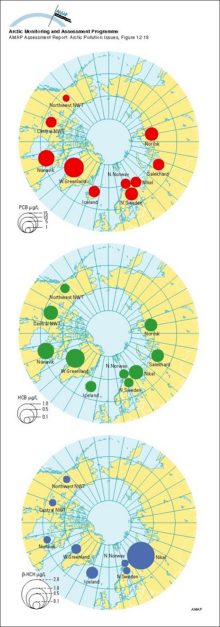
Geometric mean concentrations of PCB, HCB and B-HCH in maternal blood plasma; AMAP circumpolar study 1995, see Table 12A12Geometric mean concentrations of PCB, HCB and B-HCH in maternal blood plasma; AMAP circumpolar study 1995, see Table 12A12 |
|
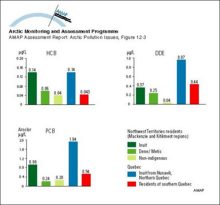
Geometric mean levels of HCB, DDE and PCBs in cord blood of newborns in different Canadian population groupsGeometric mean levels of HCB, DDE and PCBs in cord blood of newborns in different Canadian population groups |
|
Global anthropogenic inputs of trace metals to aquatic ecosystems at the beginning of the 1980s Numbers under the columns are the range of estimates of the inputs in thousands of tonnes per yearGlobal anthropogenic inputs of trace metals to aquatic ecosystems at the beginning of the 1980s Numbers under the columns are the range of estimates of the inputs in thousands of tonnes per year |
|
Global anthropogenic inputs of trace metals to soils at the beginning of the 1980s Numbers under the columns are the range of estimates of the inputs in thousands of tonnes per yearGlobal anthropogenic inputs of trace metals to soils at the beginning of the 1980s Numbers under the columns are the range of estimates of the inputs in thousands of tonnes per year |
|
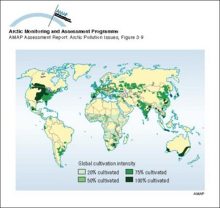
Global distribution of cultivation intensity based on a 1° x 1° latitude/longitude gridGlobal distribution of cultivation intensity based on a 1° x 1° latitude/longitude grid |
|
Global emissions of Pb to the atmosphere from various sources and source regions in 1989 Numbers under the columns are maximum estimates of the total emissions in tonnesGlobal emissions of Pb to the atmosphere from various sources and source regions in 1989 Numbers under the columns are maximum estimates of the total emissions in tonnes |

|
Global emissions of trace metals to the atmosphere at the beginning of the 1980s from anthropogenic sourcesGlobal emissions of trace metals to the atmosphere at the beginning of the 1980s from anthropogenic sources |
|
Global emissions of trace metals to the atmosphere from natural sources Numbers under the columns are the range of estimates of the emissions in thousands of tonnes per yearGlobal emissions of trace metals to the atmosphere from natural sources Numbers under the columns are the range of estimates of the emissions in thousands of tonnes per year |
|
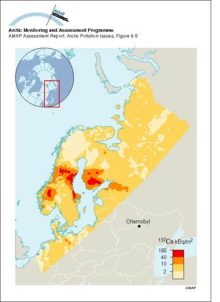
Ground deposition of 137Cs from the Chernoybl accident (values normalised to May 10, 1986)Ground deposition of 137Cs from the Chernoybl accident (values normalised to May 10, 1986) |
|
Groundwater in permafrostOccurrence of groundwater in permafrost areas |
|
Historical profiles of PCBs (trichloro- and all other) in slices from dated sediment cores in Alaska, Canada, and Finland Median age of each slice is given on the vertical axis The green lines indicate the source function of PCBsHistorical profiles of PCBs (trichloro- and all other) in slices from dated sediment cores in Alaska, Canada, and Finland Median age of each slice is given on the vertical axis The green lines [..] |

|
Historical records of a) NO3- and b) SO42- concentrations from the Greenland icecap at Dye 3 c) A comparison of trends in the average SO42- and SO42- plus NO3- concentrations at Dye 3 in Greenland and in the annual mean H+ concentration from Agassiz iceHistorical records of a) NO3- and b) SO42- concentrations from the Greenland icecap at Dye 3 c) A comparison of trends in the average SO42- and SO42- plus NO3- concentrations at Dye 3 in Greenland [..] |

|
History of snow accumulation in central Greenland during the most recent glaciation, as measured in the GISP2 core The 25-year running mean, represented in all panels, shows very large and rapid climate changesHistory of snow accumulation in central Greenland during the most recent glaciation, as measured in the GISP2 core The 25-year running mean, represented in all panels, shows very large and rapid [..] |

|
History of temperature changes in central Greenland over the last 40 000 years, from the GISP2 core, showing very large and probably abrupt changesHistory of temperature changes in central Greenland over the last 40 000 years, from the GISP2 core, showing very large and probably abrupt changes |

|
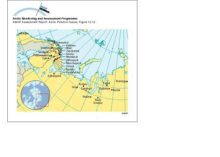
Human health study locations in Arctic Norway, Russia and Finland; red dots indicate the main communities studied under the AMAP monitoring programmeHuman health study locations in Arctic Norway, Russia and Finland; red dots indicate the main communities studied under the AMAP monitoring programme |
|
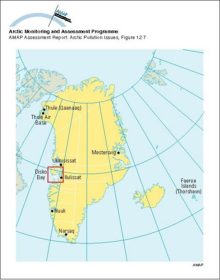
Human health study locations in Greenland and the Faeroe Islands; Disko Bay was the main area studied under the AMAP monitoring programme (1994-96)Human health study locations in Greenland and the Faeroe Islands; Disko Bay was the main area studied under the AMAP monitoring programme (1994-96) |
|
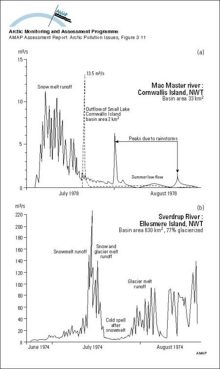
Hydrographs showing two types of streamflow regimes for Arctic rivers: a) Arctic nival regime and b) proglacial regimeHydrographs showing two types of streamflow regimes for Arctic rivers: a) Arctic nival regime and b) proglacial regime |
|
Illustration of the concept of a) the 'zone of influence' through major contaminant pathways from a major source region, and b) the 'contaminant focussing zone' resulting from the convergence of pathways carrying contaminants from a variety of sourcesIllustration of the concept of a) the 'zone of influence' through major contaminant pathways from a major source region, and b) the 'contaminant focussing zone' resulting from the convergence of [..] |
|
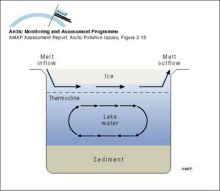
Illustration of the movement of less dense spring freshet water moving through a small Arctic lake underneath the surface ice cover, but not mixing with the water columnIllustration of the movement of less dense spring freshet water moving through a small Arctic lake underneath the surface ice cover, but not mixing with the water column |
|
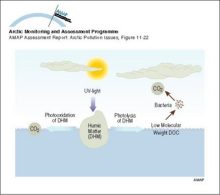
Illustration of the role of UV radiation in the biogeochemical cycling of DOCIllustration of the role of UV radiation in the biogeochemical cycling of DOC |
|
Illustration of the role of UV radiation in various light-dependent processes Natural UV radiation impacts the numbers, distribution and activity of several aquatic ecosystem targets and thus, theoretically, their interactionsIllustration of the role of UV radiation in various light-dependent processes Natural UV radiation impacts the numbers, distribution and activity of several aquatic ecosystem targets and thus, [..] |

|
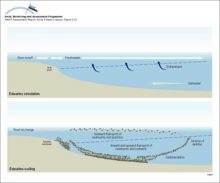
Illustration of water, sediment and nutrient cycling in estuaries Freshwater flows outward, transporting sediments, plankton and also contaminants Material that sinks into the inflowing seawater may be trapped in the estuaryIllustration of water, sediment and nutrient cycling in estuaries Freshwater flows outward, transporting sediments, plankton and also contaminants Material that sinks into the inflowing seawater may [..] |
|
Indigenous Peoples of the Canadian ArcticIndigenous Peoples of the Canadian Arctic |
|
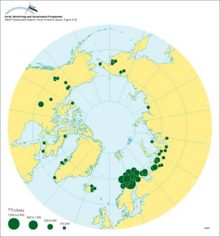
Integrated deposition density of 90SrIntegrated deposition density of 90Sr |
|
Latitudinal fluxes of sum-PCB in dated sediment cores from 25 locations including 13 Arctic locations (in Canada, Finland, and Alaska)Latitudinal fluxes of sum-PCB in dated sediment cores from 25 locations including 13 Arctic locations (in Canada, Finland, and Alaska) |
|
Latitudinal gradient of deposition of Pb in Norway in different years, as reflected by Pb concentrations in mossLatitudinal gradient of deposition of Pb in Norway in different years, as reflected by Pb concentrations in moss |
|
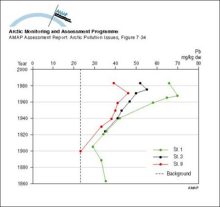
Lead and zinc in a sediment core sampled in 1991, 15 km from the Black Angel mine in West GreenlandLead and zinc in a sediment core sampled in 1991, 15 km from the Black Angel mine in West Greenland |
|
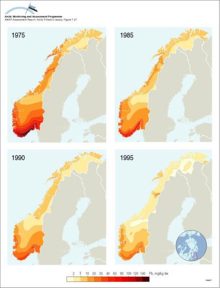
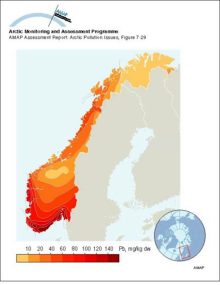
Lead concentrations in soil in Norway in 1975Lead concentrations in soil in Norway in 1975 |
|
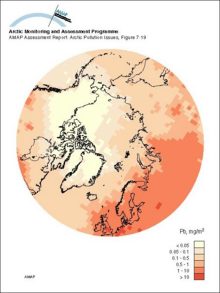
Lead deposition as modeled by the updated (1996) hemispheric EMEP transport model in a simulation for the reference year 1988Lead deposition as modeled by the updated (1996) hemispheric EMEP transport model in a simulation for the reference year 1988 |
|
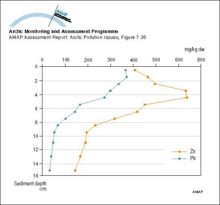
Lead in sediments near the cryolite mine at Ivittuut, south Greenland Stations 1, 3 and 9 are located at distances of 800 m, 1600 m and 5600 m, respectively, from the mineLead in sediments near the cryolite mine at Ivittuut, south Greenland Stations 1, 3 and 9 are located at distances of 800 m, 1600 m and 5600 m, respectively, from the mine |
|
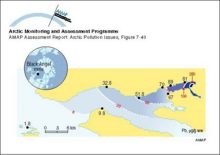
Lead levels in blue mussels (Mytilus edulis) in the fjord outside the Black Angel lead-zinc mine in West Greenland in 1986-87 Values on the fjord coast are measured concentrations Estimated concentrations in the fiord are indicated by isolinesLead levels in blue mussels (Mytilus edulis) in the fjord outside the Black Angel lead-zinc mine in West Greenland in 1986-87 Values on the fjord coast are measured concentrations Estimated [..] |
|
Levels of PCB congeners and PCDD/Fs (ng/g lw) in Lake Storvindeln pike muscle between 1968 and 1992Levels of PCB congeners and PCDD/Fs (ng/g lw) in Lake Storvindeln pike muscle between 1968 and 1992 |

|
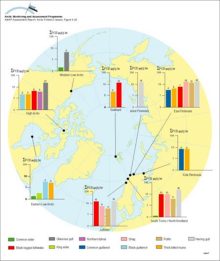
Levels of PCBs in seabird eggs (µg/g lw) Values written above bars are actual mean concentrations Wet weight means are given in Annex Table 6A16Levels of PCBs in seabird eggs (µg/g lw) Values written above bars are actual mean concentrations Wet weight means are given in Annex Table 6A16 |
|
Local differences in Cd concentrations in sedentary and stationary algae and biota from Nuuk and Uummannaq fjords, central West Greenland Levels are plotted as the percentage of the maximum concentrationsLocal differences in Cd concentrations in sedentary and stationary algae and biota from Nuuk and Uummannaq fjords, central West Greenland Levels are plotted as the percentage of the maximum [..] |
|
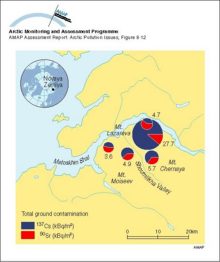
Local radionuclide contamination on Novaya ZemlyaLocal radionuclide contamination on Novaya Zemlya |
|
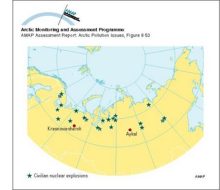
Location of PUNE’s in Arctic RussiaLocation of PUNE’s in Arctic Russia |
|
Locations of Arctic indigenous peoplesLocations of Arctic indigenous peoples |
|
Locations of sea dumping of radioactive waste in the Russian ArcticLocations of sea dumping of radioactive waste in the Russian Arctic |

|
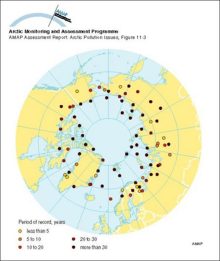
Locations of upper-air meteorological monitoring stations in the Arctic Meteorological station density for surface observations is greater for inland areas of the Arctic, while observations of any kind are sparse over the Arctic OceanLocations of upper-air meteorological monitoring stations in the Arctic Meteorological station density for surface observations is greater for inland areas of the Arctic, while observations of any [..] |
|
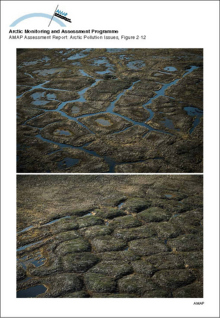
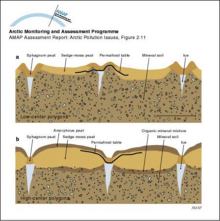
Low and high-center polygonsLow and high-center polygons |
|
Lower stratospheric (ca 120-40 hPa) Arctic temperature trends (°C per decade, January 1979 to February 1996), as monitored by MSUs on polar orbiting satellitesLower stratospheric (ca 120-40 hPa) Arctic temperature trends (°C per decade, January 1979 to February 1996), as monitored by MSUs on polar orbiting satellites |

|
Lower stratospheric temperature record since 1979Lower stratospheric temperature record since 1979 |

|
Lower tropospheric Arctic temperature trends (°C per decade, January 1979 to February 1996), as monitored by MSUs on polar orbiting satellitesLower tropospheric Arctic temperature trends (°C per decade, January 1979 to February 1996), as monitored by MSUs on polar orbiting satellites |

|
Lower tropospheric temperatures since 1979, from satellite monitoring High variability is characteristic of the Arctic region due to its isolation from the moderating influences of warm, lower latitude, ocean currentsLower tropospheric temperatures since 1979, from satellite monitoring High variability is characteristic of the Arctic region due to its isolation from the moderating influences of warm, lower [..] |

|
MAGIC model results for the streamwater at Dalelva for the past 90 years and for three future scenarios assuming a 0%, 70%, and 95% reduction of the present sulfur deposition levelsMAGIC model results for the streamwater at Dalelva for the past 90 years and for three future scenarios assuming a 0%, 70%, and 95% reduction of the present sulfur deposition levels |

|
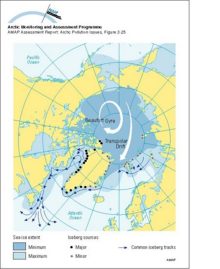
Main sources of icebergs and common iceberg drift trajectories The main ice circulation pattern follows the Transpolar Drift in the eastern Arctic and the Beaufort Gyre in the western Arctic (white arrows)Main sources of icebergs and common iceberg drift trajectories The main ice circulation pattern follows the Transpolar Drift in the eastern Arctic and the Beaufort Gyre in the western Arctic (white [..] |
|
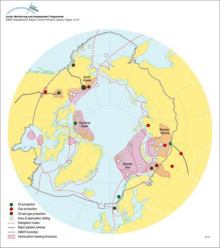
Major areas of oil and gas development and potential development in the Arctic, and major shipping routes and possible new routes through Arctic watersMajor areas of oil and gas development and potential development in the Arctic, and major shipping routes and possible new routes through Arctic waters |
|
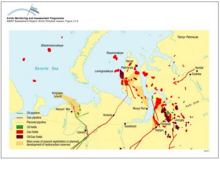
Major oil and gas development and potential development areas in Arctic Russia and the Barents Sea regionMajor oil and gas development and potential development areas in Arctic Russia and the Barents Sea region |
|
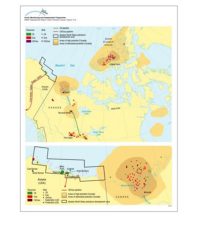
Major oil and gas development areas in Arctic Canada and on the Alaskan Beaufort Sea coastMajor oil and gas development areas in Arctic Canada and on the Alaskan Beaufort Sea coast |
|
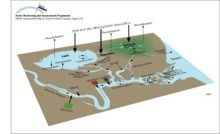
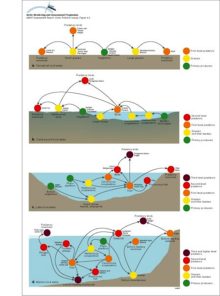
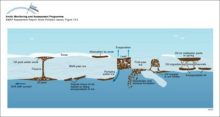
Major pathways of contaminants into and within the Arctic environmentA multi-compartment schematic diagram of the major pathways of contaminants into and within the Arctic environment |

|
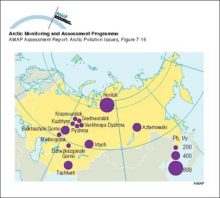
Major point sources (non-ferrous metal smelters) of Pb to the atmosphere in the Urals and the Asian part of the former Soviet UnionMajor point sources (non-ferrous metal smelters) of Pb to the atmosphere in the Urals and the Asian part of the former Soviet Union |
|
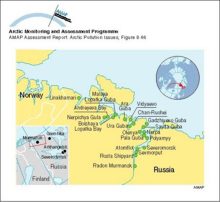
Major Russian naval bases along the Kola Peninsula and White SeaMajor Russian naval bases along the Kola Peninsula and White Sea |
|
Major surface currents in the North Atlantic OceanMajor surface currents in the North Atlantic Ocean |
|
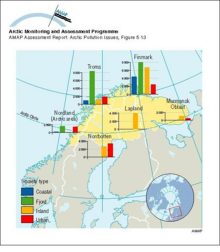
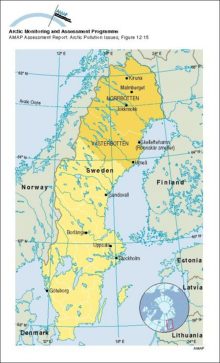
Map of Sweden showing locations mentioned in the text; Arctic areas comprise the two northernmost counties, Norrbotten and VästerbottenMap of Sweden showing locations mentioned in the text; Arctic areas comprise the two northernmost counties, Norrbotten and Västerbotten |
|
Mass transport pathways considered in the Coastal Zone Oil Spill Model (COZOIL), developed to simulate dynamic transport and weathering of oil on US Arctic coastsMass transport pathways considered in the Coastal Zone Oil Spill Model (COZOIL), developed to simulate dynamic transport and weathering of oil on US Arctic coasts |
|
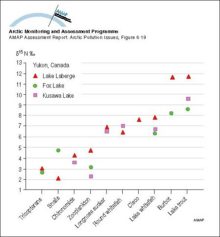
Mean delta-15 nitrogen (ppt) for invertebrates and fish collected from Laberge, Fox, and Kusawa LakesMean delta-15 nitrogen (ppt) for invertebrates and fish collected from Laberge, Fox, and Kusawa Lakes |
|
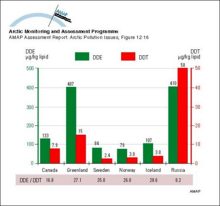
Mean maternal plasma lipid concentrations of DDE and DDT; figures below the graph show the DDE/DDT ratiosMean maternal plasma lipid concentrations of DDE and DDT; figures below the graph show the DDE/DDT ratios |
|
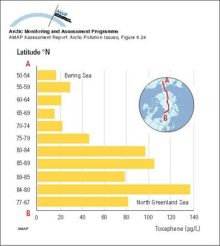
Measurements of toxaphene in surface water in the Bering Sea (1993) and the transpolar cruise (1994)Measurements of toxaphene in surface water in the Bering Sea (1993) and the transpolar cruise (1994) |
|
Median concentrations of sulfate, base cations, and nitrate in lakes of northern Fennoscandia and the Kola PeninsulaMedian concentrations of sulfate, base cations, and nitrate in lakes of northern Fennoscandia and the Kola Peninsula |
|
Migration patterns of four main stocks of eider ducks from the Canadian Arctic Organochlorines in the same four stocksMigration patterns of four main stocks of eider ducks from the Canadian Arctic Organochlorines in the same four stocks |
|
Model calculations of ground level yearly average sulfur dioxide air concentration on the Kola PeninsulaModel calculations of ground level yearly average sulfur dioxide air concentration on the Kola Peninsula |

|
Model calculations of sulfur deposition and fraction of dry deposition for the period July 1990 to June 1991 in northern Fennoscandia and the Kola PeninsulaModel calculations of sulfur deposition and fraction of dry deposition for the period July 1990 to June 1991 in northern Fennoscandia and the Kola Peninsula |

|
Model calculations of total (wet and dry) deposition estimates of sulfur for 1988Model calculations of total (wet and dry) deposition estimates of sulfur for 1988 |

|
Model evaluation comparing a five-day model simulation with results of an oil release experiment in the marginal ice zone near Svalbard in April 1993Model evaluation comparing a five-day model simulation with results of an oil release experiment in the marginal ice zone near Svalbard in April 1993 |

|
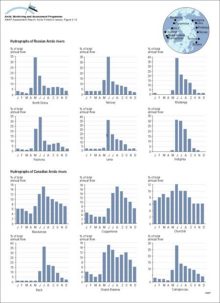
Monthly mean discharge expressed as a percent of annual discharge from available data for selected Russian and Canadian rivers draining to the ArcticMonthly mean discharge expressed as a percent of annual discharge from available data for selected Russian and Canadian rivers draining to the Arctic |
|
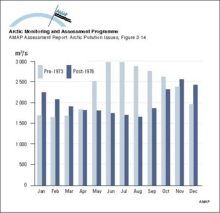
Monthly mean discharges for the Nelson River, Canada for the period 1960 to regulation in 1973, compared to post-regulation discharges from 1976 to 1990Monthly mean discharges for the Nelson River, Canada for the period 1960 to regulation in 1973, compared to post-regulation discharges from 1976 to 1990 |
|
Monthly snow cover anomalies over northern hemispheric lands (including Greenland) between January 1972 and August 1995 Also shown are the 12-month running anomalies of hemispheric snow extent, plotted on the seventh month of a given intervalMonthly snow cover anomalies over northern hemispheric lands (including Greenland) between January 1972 and August 1995 Also shown are the 12-month running anomalies of hemispheric snow extent, [..] |

|
Nickel deposition to snow on the Kola Peninsula in April 1990Nickel deposition to snow on the Kola Peninsula in April 1990 |
|
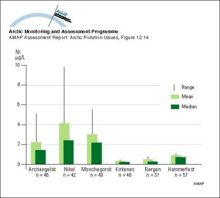
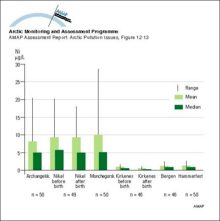
Nickel levels in urine from newborn children in different areas of Russia and NorwayNickel levels in urine from newborn children in different areas of Russia and Norway |
|
Nickel levels in urine from pregnant and delivering women in different areas of Russia and NorwayNickel levels in urine from pregnant and delivering women in different areas of Russia and Norway |
|
Norwegian counties considered in the flux vulnerability case studyNorwegian counties considered in the flux vulnerability case study |
|
Nuclear weapons test sites on Novaya ZemlyaNuclear weapons test sites on Novaya Zemlya |
|
Observed and predicted organochlorine concentrations (ng/g ww) in caribou and reindeer (Rangifer tarandus) liver All data are presented in, or were derived from data in Annex Table 6A4Observed and predicted organochlorine concentrations (ng/g ww) in caribou and reindeer (Rangifer tarandus) liver All data are presented in, or were derived from data in Annex Table 6A4 |
|
OC levels (µg/g lw in muscle) in landlocked and anadromous (italic labels) Arctic charOC levels (µg/g lw in muscle) in landlocked and anadromous (italic labels) Arctic char |
|
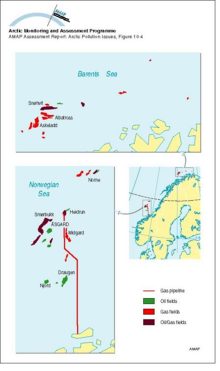
Oil and gas development areas in the Norwegian Sea and Norwegian Barents Sea regionsOil and gas development areas in the Norwegian Sea and Norwegian Barents Sea regions |
|
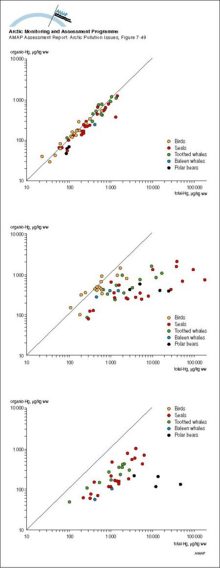
Organic mercury versus total mercury in muscle, liver and kidney tissue of Greenlandic marine animals The lines indicates 100% organic mercuryOrganic mercury versus total mercury in muscle, liver and kidney tissue of Greenlandic marine animals The lines indicates 100% organic mercury |
|
Organochlorine intake from traditional food consumed by indigenous women in the Canadian ArcticOrganochlorine intake from traditional food consumed by indigenous women in the Canadian Arctic |
|
Organochlorine levels in polar bear adipose tissues (µg/g lw), adjusted to levels expected in 11-year-old males (after correction for age and sex), for sum-PCB, sum-CHL, sum-HCH, and sum-CBz, and in Arctic fox from Svalbard for sum-PCB and sum-CHLOrganochlorine levels in polar bear adipose tissues (µg/g lw), adjusted to levels expected in 11-year-old males (after correction for age and sex), for sum-PCB, sum-CHL, sum-HCH, and sum-CBz, and in [..] |
|
Ozone soundings at Gardermoen, southern Norway, 27 January 1992 The green line denotes the partial pressure of ozone observed during the (type 1) anomaly, when low-ozone air passed over the areaOzone soundings at Gardermoen, southern Norway, 27 January 1992 The green line denotes the partial pressure of ozone observed during the (type 1) anomaly, when low-ozone air passed over the area |

|
Ozone soundings at Sodankylä, Finland, 23 March 1995 The green line denotes the profile of partial pressure of ozone observed during the (type 2) anomaly The red line shows the monthly mean ozone profile for MarchOzone soundings at Sodankylä, Finland, 23 March 1995 The green line denotes the profile of partial pressure of ozone observed during the (type 2) anomaly The red line shows the monthly mean ozone [..] |

|
PCB and toxaphene (ng/g ww) in zooplankton from the transpolar cruise of the Arctic Ocean, July-September 1994PCB and toxaphene (ng/g ww) in zooplankton from the transpolar cruise of the Arctic Ocean, July-September 1994 |
|
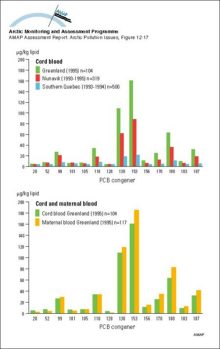
PCB congener profiles in cord blood of Canadian and Greenlandic population groups, and in cord and maternal blood from GreenlandPCB congener profiles in cord blood of Canadian and Greenlandic population groups, and in cord and maternal blood from Greenland |
|
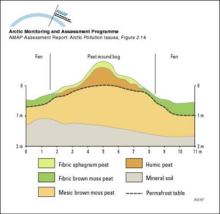
Peat mound bogCross-section of a peat mound bog |
|
Photograph of a submarine being provided with cooling water from a supply shipPhotograph of a submarine being provided with cooling water from a supply ship |
|
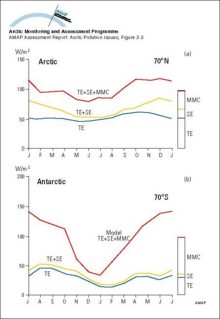
Poleward energy fluxModeled annual variation in poleward energy flux through latitude 70°, as effected by transient eddies (TE), standing eddies (SE), and mean meridional circulation (MMC) for the atmosphere from the [..] |
|
Polygon developmentLow-center and high-center polygon development |
|
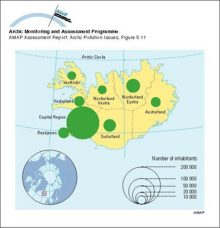
Population of Iceland, by geographic division, 1994 (based on administrative districts as of July 1, 1995)Population of Iceland, by geographic division, 1994 (based on administrative districts as of July 1, 1995) |
|
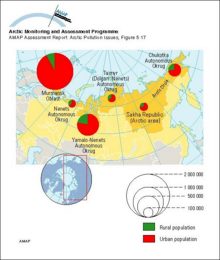
Populations by place of residence in Arctic Russia, according to the 1989 Census Populations by place of residence in Arctic Russia, according to the 1989 CensusPopulations by place of residence in Arctic Russia, according to the 1989 Census Populations by place of residence in Arctic Russia, according to the 1989 Census |
|
Precipitation in the ArcticDistribution of precipitation (mm/y) in the Arctic |
|
Precipitation rate measurements from Alert from January through April 1992 showing periods of no snow, periods of no snow measured due to wind events, and the relatively large quantities of precipitation on days duringPrecipitation rate measurements from Alert from January through April 1992 showing periods of no snow, periods of no snow measured due to wind events, and the relatively large quantities of [..] |
|
Predicted release rates of different radionuclide groups from the submarine reactor dumped in the Novaya Zemlya Trough (best estimate scenario)Predicted release rates of different radionuclide groups from the submarine reactor dumped in the Novaya Zemlya Trough (best estimate scenario) |

|
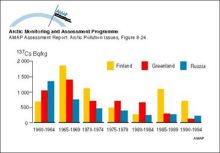
Ranges and average values of 137Cs activity concentrations in food products, from data in the AMAP radioactivity databaseRanges and average values of 137Cs activity concentrations in food products, from data in the AMAP radioactivity database |

|
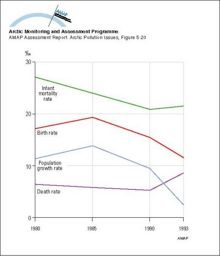
Rates of birth, death, infant mortality, and natural population growth (excluding in- and out-migration), averaged over all regions of Arctic Russia, per 1000 of population, 1980, 1985, 1990, 1993Rates of birth, death, infant mortality, and natural population growth (excluding in- and out-migration), averaged over all regions of Arctic Russia, per 1000 of population, 1980, 1985, 1990, 1993 |
|
Relative 137Cs output in foodstuffs from the different Arctic Norwegian counties in the first year after an assumed uniform deposition of 100 kBq/m2Relative 137Cs output in foodstuffs from the different Arctic Norwegian counties in the first year after an assumed uniform deposition of 100 kBq/m2 |

|
Relative tissue concentrations of organochlorine compounds detected in lichen, and in adipose tissue of caribou and wolf at three locations in the Northwest Territories, CanadaRelative tissue concentrations of organochlorine compounds detected in lichen, and in adipose tissue of caribou and wolf at three locations in the Northwest Territories, Canada |

|
River break-up in the ArcticMean dates of river break-up in the Arctic; month number in Roman numerals |
|
River freeze-up in the ArcticMean dates of river freeze-up in the Arctic |
|
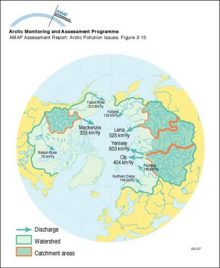
Run-off of major rivers to the Arctic OceanArctic Ocean watershed and catchment areas of some rivers and annual run-off (km3/y) of major rivers to the Arctic Ocean |
|
Scatterplots for comparisons between the average concentrations of SO2 and SO4 in air from October 1990 to December 1993 as monitored by the European Monitoring and Evaluation Programme (EMEP) and calculated by Christensen (1996)Scatterplots for comparisons between the average concentrations of SO2 and SO4 in air from October 1990 to December 1993 as monitored by the European Monitoring and Evaluation Programme (EMEP) and [..] |

|
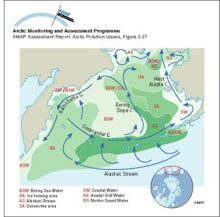
Schematic diagram of circulation and the extent of different water masses in the Bering SeaSchematic diagram of circulation and the extent of different water masses in the Bering Sea |
|
Schematic diagram of the Combined Model Ten climatic zones, each containing well-mixed compartments, are connected by meridional atmospheric and oceanic exchangeSchematic diagram of the Combined Model Ten climatic zones, each containing well-mixed compartments, are connected by meridional atmospheric and oceanic exchange |
|
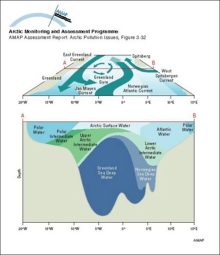
Schematic diagrams of the Greenland Sea showing the surface circulation (above) and water mass structure at a section across the central gyre (below)Schematic diagrams of the Greenland Sea showing the surface circulation (above) and water mass structure at a section across the central gyre (below) |
|
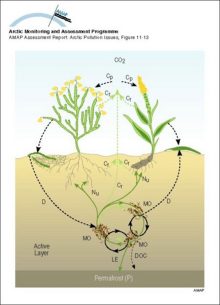
Schematic illustration of ecosystem carbon fluxes and nutrient circulation in the tundra Carbon and nutrient pathways are shown by dashed and continuous lines, respectivelySchematic illustration of ecosystem carbon fluxes and nutrient circulation in the tundra Carbon and nutrient pathways are shown by dashed and continuous lines, respectively |
|
Schematic representation of shelf processes involving transport of contaminants and sea iceSchematic representation of shelf processes involving transport of contaminants and sea ice |

|
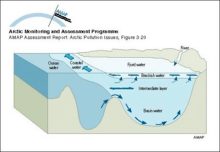
Schematic representation of the temperature and salinity structure of the upper Arctic Ocean and how the halocline layer is maintained by brine-rich water produced on the shelvesSchematic representation of the temperature and salinity structure of the upper Arctic Ocean and how the halocline layer is maintained by brine-rich water produced on the shelves |

|
Seasonal and annual average surface temperature trends (°C per decade) over the northern hemisphereSeasonal and annual average surface temperature trends (°C per decade) over the northern hemisphere |

|
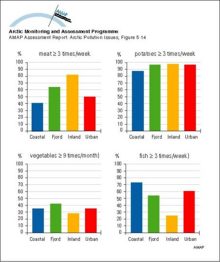
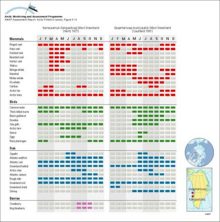
Seasonal resource utilization patterns, by month, for two communities in West GreenlandSeasonal resource utilization patterns, by month, for two communities in West Greenland |
|
Seawater concentrations of 137Cs in the Barents and East Greenland Seas compared to the yearly releases from SellafieldSeawater concentrations of 137Cs in the Barents and East Greenland Seas compared to the yearly releases from Sellafield |

|
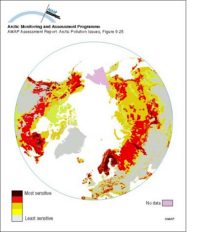
Sensitivity of Arctic ecosystems to acid depositionSensitivity of Arctic ecosystems to acid deposition |
|
Sequence of oil-ice interaction including drops under the ice, new ice growth below the oil, oil appearing on the surface in the spring, wind herding of oil on melt pools, and the appearance of emulsified oil on top of the iceSequence of oil-ice interaction including drops under the ice, new ice growth below the oil, oil appearing on the surface in the spring, wind herding of oil on melt pools, and the appearance of [..] |
|
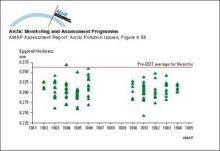
Shell thickness (mm) of peregrine falcon eggs representing 109 clutches produced in Rankin Inlet, NWT, Canada from 1981 to 1986 and from 1990 to 1994Shell thickness (mm) of peregrine falcon eggs representing 109 clutches produced in Rankin Inlet, NWT, Canada from 1981 to 1986 and from 1990 to 1994 |
|
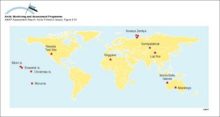
Sites where atmospheric testing of nuclear weapons has taken place since 1945Sites where atmospheric testing of nuclear weapons has taken place since 1945 |
|
Sketch of main circulation pattern in a fjordSketch of main circulation pattern in a fjord |
|
SMART model results for selected soil and lake output variables at Christmas lakes for the past 90 years and for three future scenarios assuming a 0%, 70% and 95% reduction of the present sulfur deposition levelsSMART model results for selected soil and lake output variables at Christmas lakes for the past 90 years and for three future scenarios assuming a 0%, 70% and 95% reduction of the present sulfur [..] |

|
Snow cover over northern hemisphere lands between 1972 and 1996 for different seasons Values are determined from analyses of NOAA snow charts created using visible satellite imagerySnow cover over northern hemisphere lands between 1972 and 1996 for different seasons Values are determined from analyses of NOAA snow charts created using visible satellite imagery |

|
SO2 emissions north of 50°N (modified after Benkovitz et al 1995, see Figure 91) showing point source emissions from Arctic and subarctic non-ferrous smelters and including natural DMS sources from the North Atlantic Ocean Area sources are not includedSO2 emissions north of 50°N (modified after Benkovitz et al 1995, see Figure 91) showing point source emissions from Arctic and subarctic non-ferrous smelters and including natural DMS sources from [..] |
|
Some of the dumped containers in Stepovogo BaySome of the dumped containers in Stepovogo Bay |
|
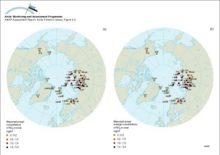
Source regions for HCH, chlordane, toxaphene, and PCBs in Arctic air based on 5-day back-trajectories for elevated air concentrations at Tagish, Alert, and Ny-ÅlesundSource regions for HCH, chlordane, toxaphene, and PCBs in Arctic air based on 5-day back-trajectories for elevated air concentrations at Tagish, Alert, and Ny-Ålesund |

|
Spatial distribution of emissions of Pb within the 150 km x 150 km EMEP grid system for the area north of latitude 50° N in 1989Spatial distribution of emissions of Pb within the 150 km x 150 km EMEP grid system for the area north of latitude 50° N in 1989 |

|
Spatial distribution of global emissions of Hg in 1990 within a 1° x 1° grid The total emission inventory is 2144 tonnes HgSpatial distribution of global emissions of Hg in 1990 within a 1° x 1° grid The total emission inventory is 2144 tonnes Hg |

|
Spatial trends in the net flux from reindeer meat in different Arctic areas, for the first year after an assumed uniform deposition of 100 kBq/m2Spatial trends in the net flux from reindeer meat in different Arctic areas, for the first year after an assumed uniform deposition of 100 kBq/m2 |

|
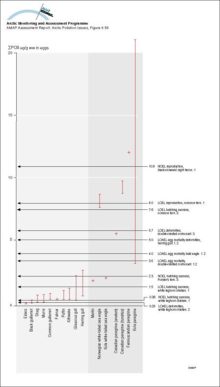
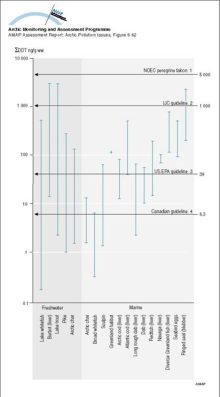
Sum-DDT (ng/g ww) in Arctic animals as food items compared to no-effect-concentrations (NOAEC) and environmental quality guidelines for protecting fish-eating/aquatic wildlife (1 Baril et al 1990, 2 USEPA 1995,Sum-DDT (ng/g ww) in Arctic animals as food items compared to no-effect-concentrations (NOAEC) and environmental quality guidelines for protecting fish-eating/aquatic wildlife (1 Baril et al 1990, 2 [..] |
|
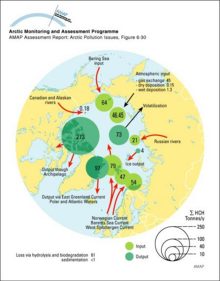
Sum-HCH budget for the Arctic Ocean (tonnes/y)Sum-HCH budget for the Arctic Ocean (tonnes/y) |
|
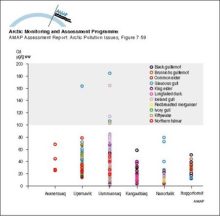
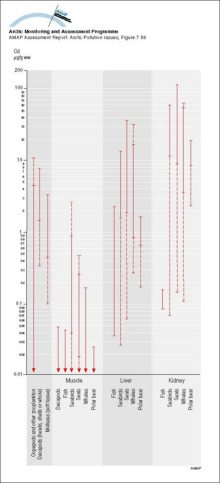
Summary of ranges of Cd levels (mean values) in Arctic marine organisms Solid parts of the lines indicate ranges for Greenlandic dataSummary of ranges of Cd levels (mean values) in Arctic marine organisms Solid parts of the lines indicate ranges for Greenlandic data |
|
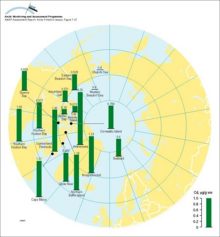
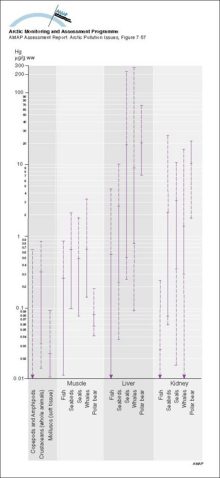
Summary of ranges of Hg levels (mean values) in Arctic marine organisms Solid parts of the lines indicate ranges for Greenlandic dataSummary of ranges of Hg levels (mean values) in Arctic marine organisms Solid parts of the lines indicate ranges for Greenlandic data |
|
Summary of ranges of Pb levels (mean values) in Arctic marine organisms Solid parts of the lines indicate ranges for Greenlandic dataSummary of ranges of Pb levels (mean values) in Arctic marine organisms Solid parts of the lines indicate ranges for Greenlandic data |
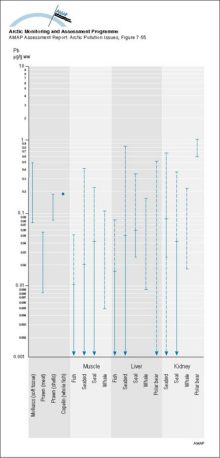
|
Summary of ranges of Se levels (mean values) in Arctic marine organisms Solid parts of the lines indicate ranges for Greenlandic dataSummary of ranges of Se levels (mean values) in Arctic marine organisms Solid parts of the lines indicate ranges for Greenlandic data |
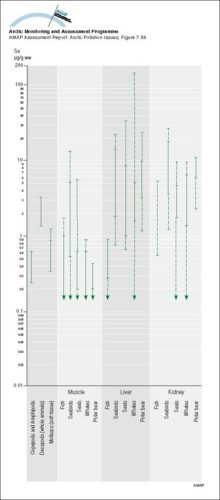
|
Summer and winter visibility observations (for relative humidities less than 80%) for the period 1951 to 1993 in North AmericaSummer and winter visibility observations (for relative humidities less than 80%) for the period 1951 to 1993 in North America |

|
Sum-PCB (ng/g lw) in Arctic mammals compared to thresholds for mammalian effects (1 Leonards et al 1995, 2 Tryphonas 1994, 3 Kihlström et al 1992, 4 Olsson et al 1996a, 5 Boon et al 1987, 6 Ahlborg et al 1992, 7 Helle et al 1976b)Sum-PCB (ng/g lw) in Arctic mammals compared to thresholds for mammalian effects (1 Leonards et al 1995, 2 Tryphonas 1994, 3 Kihlström et al 1992, 4 Olsson et al 1996a, 5 Boon et al 1987, 6 Ahlborg et [..] |
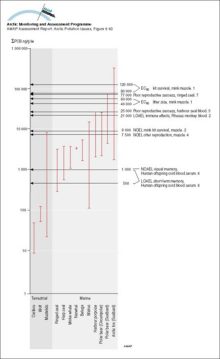
|
Sum-PCB (ng/g ww) in Arctic animals as food items compared to no-effect-concentrations (NOAEC) and environmental quality guidelines for protecting fish-eating/aquatic wildlife (1 Baril et al 1990, 2 USEPA 1995,Sum-PCB (ng/g ww) in Arctic animals as food items compared to no-effect-concentrations (NOAEC) and environmental quality guidelines for protecting fish-eating/aquatic wildlife (1 Baril et al 1990, 2 [..] |
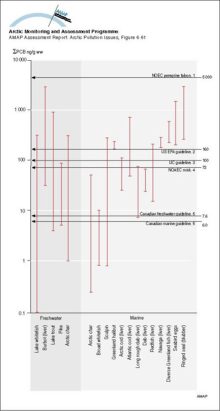
|
Sum-PCB and sum-DDT (ng/g lw) in Arctic cod liver, 1994-95Sum-PCB and sum-DDT (ng/g lw) in Arctic cod liver, 1994-95 |
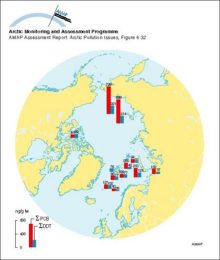
|
Sum-PCB and sum-DDT in ringed seal blubber (µg/g) Vertical bars denote standard deviationSum-PCB and sum-DDT in ringed seal blubber (µg/g) Vertical bars denote standard deviation |
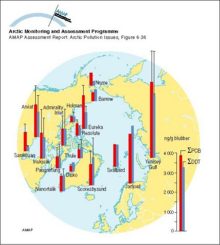
|
Sum-PCB levels in cetaceans in NorwaySum-PCB levels in cetaceans in Norway |
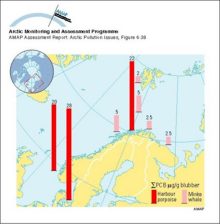
|
Sum-PCB levels in pinnipeds in NorwaySum-PCB levels in pinnipeds in Norway |
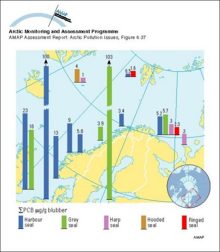
|
Surface currents in Hudson Bay, Hudson Strait and Foxe BasinSurface currents in Hudson Bay, Hudson Strait and Foxe Basin |
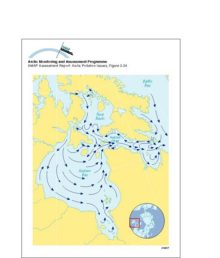
|
Surface currents in the Arctic region Square boxes indicate that the denser inflowing (Atlantic and Pacific) waters are submerging under the Polar Surface Water The continuation of these flows can be seen in Figure a03-27Surface currents in the Arctic region Square boxes indicate that the denser inflowing (Atlantic and Pacific) waters are submerging under the Polar Surface Water The continuation of these flows can be [..] |
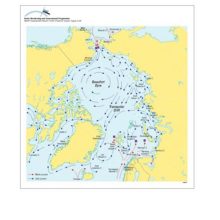
|
Surface ocean currents in the ArcticSurface ocean currents in the Arctic |
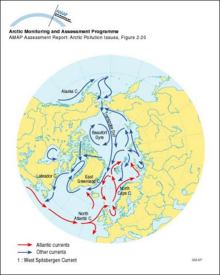
|
Temperature and salinity of the Labrador Sea The cold freshwater from the Arctic Ocean and Baffin Bay is seen above the continental shelfTemperature and salinity of the Labrador Sea The cold freshwater from the Arctic Ocean and Baffin Bay is seen above the continental shelf |

|
Temporal trend of Pb concentrations in growing tips of seaweed (Fucus vesiculosus) at the Black Angel lead-zinc mine in West Greenland The background value is estimated to be 02 µg/g dwTemporal trend of Pb concentrations in growing tips of seaweed (Fucus vesiculosus) at the Black Angel lead-zinc mine in West Greenland The background value is estimated to be 02 µg/g dw |

|
Temporal trend of Pb concentrations in liver tissue of spotted wolffish (Anarhichas minor) at the Black Angel lead-zinc mine in West GreenlandTemporal trend of Pb concentrations in liver tissue of spotted wolffish (Anarhichas minor) at the Black Angel lead-zinc mine in West Greenland |

|
Temporal trends in concentrations of sum-HCH and toxaphene in Arctic airTemporal trends in concentrations of sum-HCH and toxaphene in Arctic air |

|
Temporal trends in levels of PCB, DDT, alpha-HCH, and HCB in muscle from Lake Storvindeln pike and Lake Abiskojaure char in Sweden Mean levels (µg/g lw) and 95% confidence intervals of the mean are represented by dark points,Temporal trends in levels of PCB, DDT, alpha-HCH, and HCB in muscle from Lake Storvindeln pike and Lake Abiskojaure char in Sweden Mean levels (µg/g lw) and 95% confidence intervals of the mean are [..] |

|
Temporal trends in OC levels (ng/g lw) in reindeer from Abisko, Sweden Levels are usually based on a pool of 10 samplesTemporal trends in OC levels (ng/g lw) in reindeer from Abisko, Sweden Levels are usually based on a pool of 10 samples |

|
Temporal trends in PCB and DDE levels in Arctic seabird eggs from Prince Leopold Island, Canada (1975-1993)Temporal trends in PCB and DDE levels in Arctic seabird eggs from Prince Leopold Island, Canada (1975-1993) |

|
Temporal trends in PCB and DDT levels (µg/g lw ± 95% confidence limits) of otter muscle in Sweden Levels are based on means of 26, 16, and 28 samples (northern Sweden) and 29, 9, and 15 samples (southern Sweden)Temporal trends in PCB and DDT levels (µg/g lw ± 95% confidence limits) of otter muscle in Sweden Levels are based on means of 26, 16, and 28 samples (northern Sweden) and 29, 9, and 15 samples [..] |

|
Temporal trends of sum-PCB and sum-DDT in blubber of female ringed seals from Holman Island in the western Canadian Arctic Vertical bars represent one SDTemporal trends of sum-PCB and sum-DDT in blubber of female ringed seals from Holman Island in the western Canadian Arctic Vertical bars represent one SD |

|
Temporal variation in calculated reindeer Tag values for different Arctic regionsTemporal variation in calculated reindeer Tag values for different Arctic regions |

|
Temporal variation in cow milk Tag values for Sweden, Norway and FinlandTemporal variation in cow milk Tag values for Sweden, Norway and Finland |

|
Ten-year averages of 90Sr activity concentrations in drinking water and precipitation in GreenlandTen-year averages of 90Sr activity concentrations in drinking water and precipitation in Greenland |
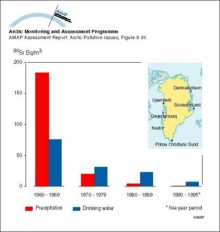
|
The changing inventory of major radionuclides in the Komsomolets reactor with timeThe changing inventory of major radionuclides in the Komsomolets reactor with time |
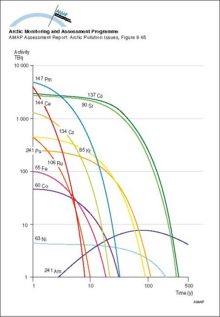
|
The comparative importance of different foodstuffs as sources of 137Cs for the three Arctic Norwegian counties over the 1-year and 50-year period following an assumed uniform deposition of 100 kBq/m2The comparative importance of different foodstuffs as sources of 137Cs for the three Arctic Norwegian counties over the 1-year and 50-year period following an assumed uniform deposition of 100 kBq/m2 |

|
The different domains of the Bering Sea continental shelf are separated by fronts The coastal domain (depth <50m) tends to be vertically homogeneous, the middle domain (50-100m) shows a clear two-layered structure, while the outer domain (100-170m)The different domains of the Bering Sea continental shelf are separated by fronts The coastal domain (depth <50m) tends to be vertically homogeneous, the middle domain (50-100m) shows a clear [..] |
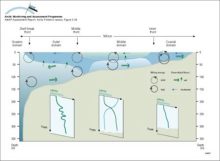
|
The hydrologic balance in the Arctic is highly dynamic on the seasonal time scale with large and rapid ice melts in the spring On land, this ice and snow melting results in large rapid floods and surges in riversThe hydrologic balance in the Arctic is highly dynamic on the seasonal time scale with large and rapid ice melts in the spring On land, this ice and snow melting results in large rapid floods and [..] |

|
The predicted (1988) average surface air sulfate concentrations in the ArcticThe predicted (1988) average surface air sulfate concentrations in the Arctic |

|
The predicted (1988) average surface air sulfur dioxide concentrations in the ArcticThe predicted (1988) average surface air sulfur dioxide concentrations in the Arctic |

|
The predominant currents in the Arctic Ocean and their major routes around the basin edges of the ArcticThe predominant currents in the Arctic Ocean and their major routes around the basin edges of the Arctic |
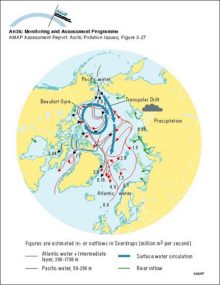
|
The relationship between response levels of biological organization and the toxicological relevance and time scale of responsesThe relationship between response levels of biological organization and the toxicological relevance and time scale of responses |
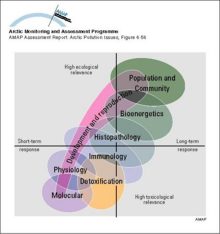
|
The relative contribution to the 137Cs content of the diet of the ‘average’ population of various Arctic areas for the period 1990 to 1994The relative contribution to the 137Cs content of the diet of the ‘average’ population of various Arctic areas for the period 1990 to 1994 |
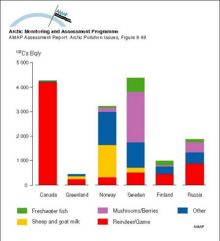
|
The relative contribution to the 137Cs content of the diet of the ‘selected’ population of various Arctic areas for the period 1990 to 1994The relative contribution to the 137Cs content of the diet of the ‘selected’ population of various Arctic areas for the period 1990 to 1994 |
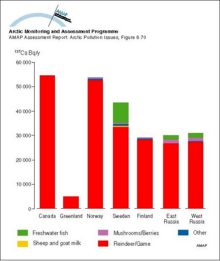
|
The relative importance of different branches of industry in discharges of Cu, Ni, Pb and Zn to the aquatic environment from major point sources in the European Community (EC)The relative importance of different branches of industry in discharges of Cu, Ni, Pb and Zn to the aquatic environment from major point sources in the European Community (EC) |
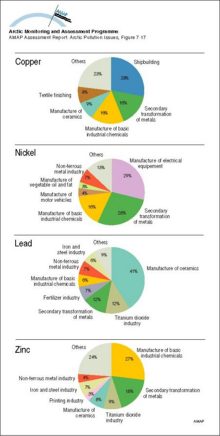
|
The system of dams and drainage channels at MayakThe system of dams and drainage channels at Mayak |
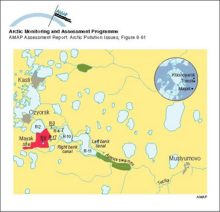
|
The ten major point sources, and their emissions of As and Cd to the atmosphere, in Europe at the beginning of the 1990s Numbers above the columns are emissions in tonnes per yearThe ten major point sources, and their emissions of As and Cd to the atmosphere, in Europe at the beginning of the 1990s Numbers above the columns are emissions in tonnes per year |

|
The time series of (a) weekly-averaged non-seasalt (nss) sulfate aerosol at Alert, NWT, Canada, (b) monthly-averaged sulfate aerosol at Ny Ålesund, Norway, (c) weekly-averaged nitrate at Alert, and (d) weekly-averaged hydrogen ion at AlertThe time series of (a) weekly-averaged non-seasalt (nss) sulfate aerosol at Alert, NWT, Canada, (b) monthly-averaged sulfate aerosol at Ny Ålesund, Norway, (c) weekly-averaged nitrate at Alert, and [..] |

|
The time series of light scattering (?sp) and optical depth (?) at 500 nm at Barrow, AlaskaThe time series of light scattering (?sp) and optical depth (?) at 500 nm at Barrow, Alaska |

|
Theoretical clear day UV dose to horizontal and vertical surfaces, for Arctic FinlandTheoretical clear day UV dose to horizontal and vertical surfaces, for Arctic Finland |
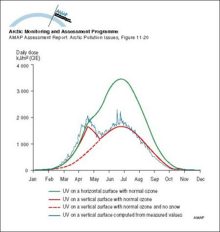
|
Time series of emissions of SO2 from European sources (Mylona 1993) and two major sources on the Kola PeninsulaTime series of emissions of SO2 from European sources (Mylona 1993) and two major sources on the Kola Peninsula |

|
Time trends of mean methylmercury concentrationsTime trends of mean methylmercury concentrations |

|
Total and composition of subsistence production for small and mid-sized communities in selected areas of AlaskaTotal and composition of subsistence production for small and mid-sized communities in selected areas of Alaska |
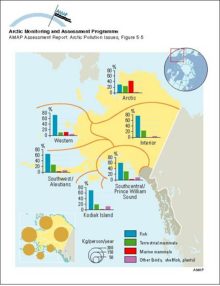
|
Total and indigenous minority populations in the Arctic area of the Russian Federation, by region, according to the 1989 CensusTotal and indigenous minority populations in the Arctic area of the Russian Federation, by region, according to the 1989 Census |
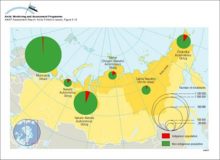
|
Total and indigenous populations of Arctic Alaska, by Native Regional Corporation regionTotal and indigenous populations of Arctic Alaska, by Native Regional Corporation region |
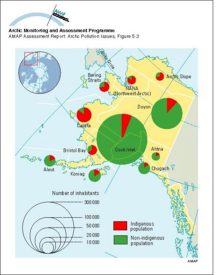
|
Total and indigenous populations of Arctic CanadaTotal and indigenous populations of Arctic Canada |
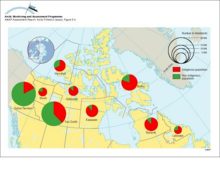
|
Total and indigenous populations of Greenland, by municipality, 1994Total and indigenous populations of Greenland, by municipality, 1994 |
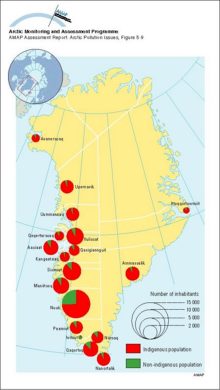
|
Total and indigenous populations of the Arctic, by Arctic area of each country (the data from Russia are for the indigenous minority population)Total and indigenous populations of the Arctic, by Arctic area of each country (the data from Russia are for the indigenous minority population) |
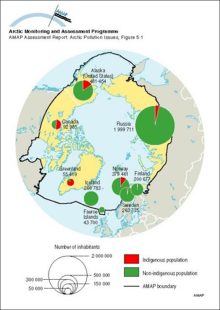
|
Total and Saami populations of Arctic areas of Fennoscandia (based on national census data)Total and Saami populations of Arctic areas of Fennoscandia (based on national census data) |
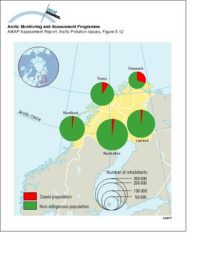
|
Tracer concentration on a vertical section (along Y=0 on Figure 346) after 15 years; a) no neptune, centered difference; b) neptune, flux-corrected transport; c,d) velocity normal to the section with positive "into" the page, negative "out" of the page;Tracer concentration on a vertical section (along Y=0 on Figure 346) after 15 years; a) no neptune, centered difference; b) neptune, flux-corrected transport; c,d) velocity normal to the section with [..] |
|
Traditional Inuit slit goggles from Greenland; the goggles protect the eyes against ultraviolet radiationTraditional Inuit slit goggles from Greenland; the goggles protect the eyes against ultraviolet radiation |
|
Transport of 90Sr, originating from Sellafield, along the coast of Norway The highest values are found in the Norwegian Coastal Current and decrease northwardTransport of 90Sr, originating from Sellafield, along the coast of Norway The highest values are found in the Norwegian Coastal Current and decrease northward |

|
Trends in (annual average) ozone mixing ratio over Canada from 1980 to 1993Trends in (annual average) ozone mixing ratio over Canada from 1980 to 1993 |

|
Trends in alpha-HCH and enantiomer ratios (ER) on a transect from the Bering Sea across the polar cap to the Greenland Sea during the Arctic Ocean Transect Study of July and August 1994Trends in alpha-HCH and enantiomer ratios (ER) on a transect from the Bering Sea across the polar cap to the Greenland Sea during the Arctic Ocean Transect Study of July and August 1994 |
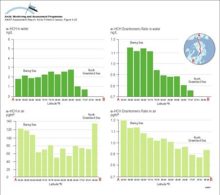
|
Trends in concentration of major organochlorines in blubber of female ringed seals over 6 to 10 years at 3 sites in the eastern Canadian Arctic (N=10-14 animals for each year/site)Trends in concentration of major organochlorines in blubber of female ringed seals over 6 to 10 years at 3 sites in the eastern Canadian Arctic (N=10-14 animals for each year/site) |

|
Trends in sum-PCB, sum-DDT, sum-CHL, and toxaphene over a ten year period (20 years for DDT in the Mackenzie Delta) for male narwhal and beluga blubber samples from the Canadian Arctic (N=8-26)Trends in sum-PCB, sum-DDT, sum-CHL, and toxaphene over a ten year period (20 years for DDT in the Mackenzie Delta) for male narwhal and beluga blubber samples from the Canadian Arctic (N=8-26) |

|
Ultraviolet albedo and transmittance values for (A) thin (03 m) bare sea; (B) cold 16 m thick ice with a 01 m deep snow cover in April; (C) bare 17 m thick ice in May; and, (D) ponded ice with 01 m of water over 15 m thick iceUltraviolet albedo and transmittance values for (A) thin (03 m) bare sea; (B) cold 16 m thick ice with a 01 m deep snow cover in April; (C) bare 17 m thick ice in May; and, (D) ponded ice with 01 m of [..] |
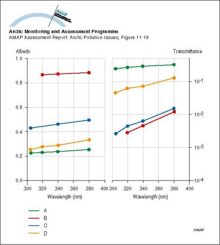
|
Variation of PCB with age in blubber of ringed seals (western Hudson Bay, Canada) A total of 24 females and 30 males were analyzedVariation of PCB with age in blubber of ringed seals (western Hudson Bay, Canada) A total of 24 females and 30 males were analyzed |
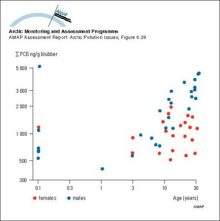
|
Variation of the nitrate to non-seasalt (nss) sulfate equivalent ratio in precipitation at Norwegian recording stations based on measurements between August 1982 and July 1984Variation of the nitrate to non-seasalt (nss) sulfate equivalent ratio in precipitation at Norwegian recording stations based on measurements between August 1982 and July 1984 |
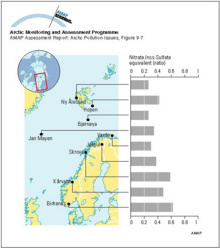
|
Vegetation damage zones around NorilskVegetation damage zones around Norilsk |
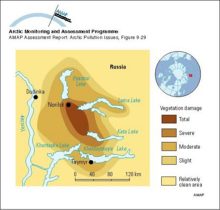
|
Vertical distribution of Arctic haze in summer, winter, and the whole year Sulfur air concentrations and relative source-contribution (%) for different heights above the ground are shown The concentrations are averages over the Arctic area north of 70°NVertical distribution of Arctic haze in summer, winter, and the whole year Sulfur air concentrations and relative source-contribution (%) for different heights above the ground are shown The [..] |

|
Vertical profiles of HCH for the Arctic OceanVertical profiles of HCH for the Arctic Ocean |
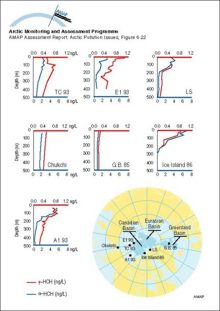
|
Vertically integrated tracer burden shown after 15 years Units are burden per unit surface area, normalized by cumulative release Bottom topography is in meters; a) no neptune, centered difference, and b) neptune, flux-corrected transportVertically integrated tracer burden shown after 15 years Units are burden per unit surface area, normalized by cumulative release Bottom topography is in meters; a) no neptune, centered difference, [..] |
|
Water/air fugacity ratios (fw/fa) of alpha-HCH and gamma-HCH on a transect from the Bering Sea to the Greenland Sea in July and August 1994 A fugacity ratio of 1 indicates air-water equilibriumWater/air fugacity ratios (fw/fa) of alpha-HCH and gamma-HCH on a transect from the Bering Sea to the Greenland Sea in July and August 1994 A fugacity ratio of 1 indicates air-water equilibrium |

|
Winter and summer surface water salinity in the Arctic Ocean and adjacent seasWinter and summer surface water salinity in the Arctic Ocean and adjacent seas |

|
Winter and summer surface water temperatures in the Arctic Ocean and adjacent seasWinter and summer surface water temperatures (°C) in the Arctic Ocean and adjacent seas |
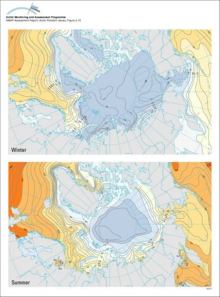
|
Winter concentrations of metals in air at remote locations in the Arctic at the beginning of the 1980s and 1990s, and European emissions of As, Pb and Zn during the same periodsWinter concentrations of metals in air at remote locations in the Arctic at the beginning of the 1980s and 1990s, and European emissions of As, Pb and Zn during the same periods |
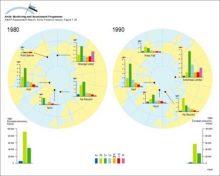
|
Yearly and depth-averaged concentrations (Bq/m3) of 137Cs after 6 years from Harms' model The sources are instantaneous releases of 1 PBq from the dump sites in Abrosimov Bay, Stepovogo Bay, Tsivolky Bay, and Novaya Zemlya TroughYearly and depth-averaged concentrations (Bq/m3) of 137Cs after 6 years from Harms' model The sources are instantaneous releases of 1 PBq from the dump sites in Abrosimov Bay, Stepovogo Bay, Tsivolky [..] |
|
Yearly intake of 137Cs from various dietary components by the ‘selected’ population of Arctic CanadaYearly intake of 137Cs from various dietary components by the ‘selected’ population of Arctic Canada |
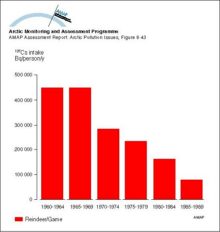
|
Yearly intake of 137Cs from various dietary components by the ‘selected’ population of Arctic FinlandYearly intake of 137Cs from various dietary components by the ‘selected’ population of Arctic Finland |
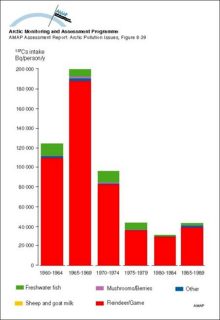
|
Yearly intake of 137Cs from various dietary components by the ‘selected’ population of Arctic NorwayYearly intake of 137Cs from various dietary components by the ‘selected’ population of Arctic Norway |
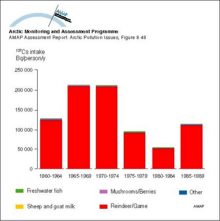
|
Yearly intake of 137Cs from various dietary components by the ‘selected’ population of Arctic SwedenYearly intake of 137Cs from various dietary components by the ‘selected’ population of Arctic Sweden |
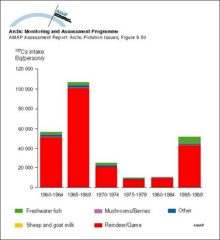
|
Yearly intake of 137Cs from various dietary components by the ‘selected’ population of eastern Arctic RussiaYearly intake of 137Cs from various dietary components by the ‘selected’ population of eastern Arctic Russia |
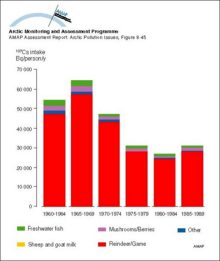
|
Yearly intake of 137Cs from various dietary components by the ‘selected’ population of GreenlandYearly intake of 137Cs from various dietary components by the ‘selected’ population of Greenland |
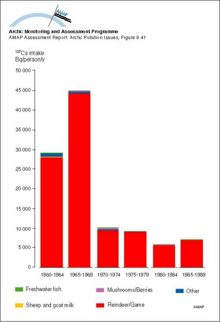
|
Yearly intake of 137Cs from various dietary components by the ‘selected’ population of western Arctic RussiaYearly intake of 137Cs from various dietary components by the ‘selected’ population of western Arctic Russia |
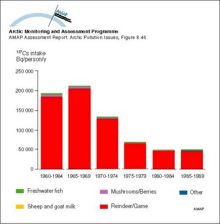
|
Yearly intake of 137Cs from various dietary components by the average population of Arctic CanadaYearly intake of 137Cs from various dietary components by the average population of Arctic Canada |
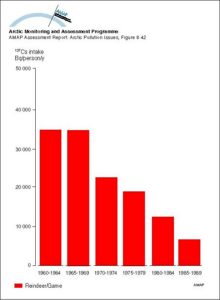
|
Yearly intake of 137Cs from various dietary components by the average population of Arctic FinlandYearly intake of 137Cs from various dietary components by the average population of Arctic Finland |
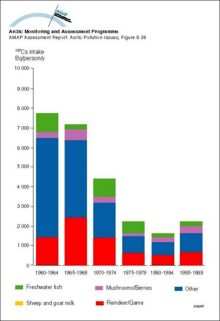
|
Yearly intake of 137Cs from various dietary components by the average population of Arctic NorwayYearly intake of 137Cs from various dietary components by the average population of Arctic Norway |
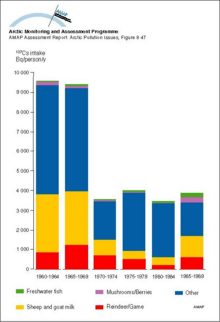
|
Yearly intake of 137Cs from various dietary components by the average population of Arctic RussiaYearly intake of 137Cs from various dietary components by the average population of Arctic Russia |
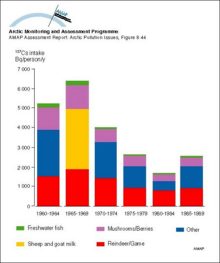
|
Yearly intake of 137Cs from various dietary components by the average population of Arctic SwedenYearly intake of 137Cs from various dietary components by the average population of Arctic Sweden |
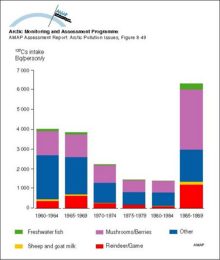
|
Yearly intake of 137Cs from various dietary components by the average population of GreenlandYearly intake of 137Cs from various dietary components by the average population of Greenland |
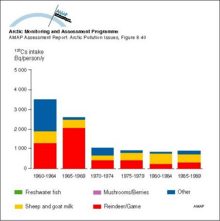
|
