More information and download links below the graphic.
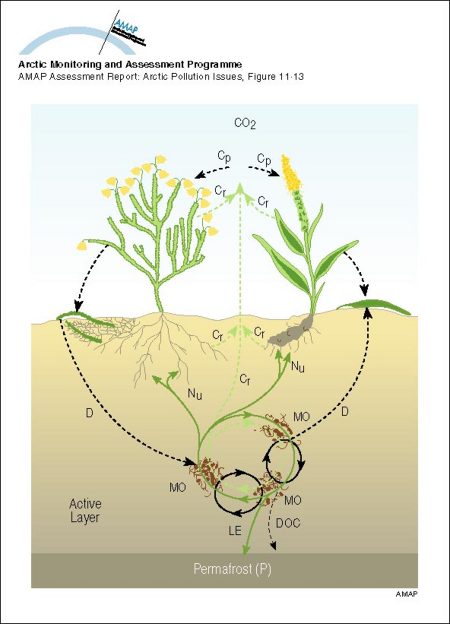
Schematic illustration of ecosystem carbon fluxes and nutrient circulation in the tundra Carbon and nutrient pathways are shown by dashed and continuous lines, respectively

Click here, or on the graphic, for full resolution.
Schematic illustration of ecosystem carbon fluxes and nutrient circulation in the tundra Carbon and nutrient pathways are shown by dashed and continuous lines, respectively
| Sources | Title (cont.) Atmospheric CO2 is fixed in the plants through photosynthesis (Cp). Dead parts of plants with organic carbon and nutrients fall to the ground as litter and enter the decomposition cycle (D) where they are transformed into soil organic matter. The organic matter with its nutrients undergoes complicated transformations in the soil microbial biomass (MO). Carbon is continuously lost to the atmosphere as CO2 through microbial and plant respiration (Cr) and made available directly for plant photosynthesis or added to the atmospheric pool (CO2). Nutrients are circulated within the microbial system of the soil or traded-off and taken-up by the plants (Nu). Microbial activity is limited by, among other things, low temperatures due to permafrost (P). Some carbon and nutrients can be lost from the system as dissolved organic matter (DOC) or nutrient leachate (LE) and transported to adjacent systems. Climate change acts on the system mainly by controlling the rate of CO2 uptake by plants, and the activity of micro-organisms. Tundra ecosystems differ from others in that the cold soils have large stores of nutrients and carbon, and the microbial biomass has low rates of CO2 uptake, i.e. low productivity. adapted from: Callaghan T.V. and S. Jonasson, 1995. Arctic terrestrial ecosystems and environmental change. Philosophical Transactions of the Royal Society, London 352: 259-276. (AAR Figure 11.13) | ||||
|
Cartographer/ Designer |
Graphical production: Philippe Rekacewicz and Emmanuelle Bournay (GRID-Arendal) | ||||
| Appears in |
AMAP Assessment Report: Arctic Pollution Issues |
||||
| Published | 1998 | ||||
| Feedback/Comment/Inquiry | Contact webmaster | ||||
| Search for other graphics |
With related subjects Covering the same geographic area |
||||
|
Available Downloads
(please review use constraints above) |
|
||||
|
Citation/Reference Use constraints |
Please refer to the AMAP policy regarding use and reproduction of AMAP maps and graphics |
