More information and download links below the graphic.
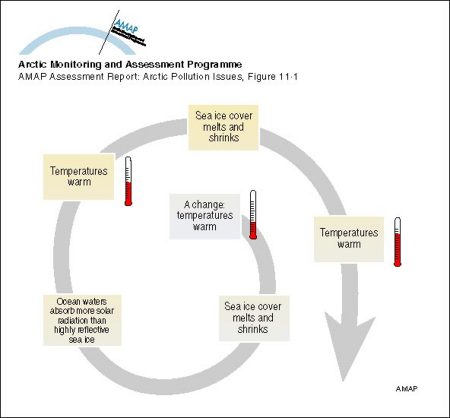
An example of a positive feedback loop Warming leads to a decrease in sea ice cover which in turn leads to a decrease in albedo over the ocean, the result of which is further warming and further decreases in the sea ice cover

Click here, or on the graphic, for full resolution.
An example of a positive feedback loop Warming leads to a decrease in sea ice cover which in turn leads to a decrease in albedo over the ocean, the result of which is further warming and further decreases in the sea ice cover
| Sources | Title (cont.) In the reverse situation, if sea ice cover, and hence albedo, were to increase, the feedback would lead to cooler air temperatures, thus promoting greater sea ice cover. In either case, the feedback loops are positive, i.e. the change is amplified by the system feeding-back onto itself. Negative feedbacks help regulate a system causing changes to be moderated or diminished. (AAR Figure 11.1) | ||||
|
Cartographer/ Designer |
Graphical production: Philippe Rekacewicz and Emmanuelle Bournay (GRID-Arendal) | ||||
| Appears in |
AMAP Assessment Report: Arctic Pollution Issues |
||||
| Published | 1998 | ||||
| Feedback/Comment/Inquiry | Contact webmaster | ||||
| Search for other graphics |
With related subjects Covering the same geographic area |
||||
|
Available Downloads
(please review use constraints above) |
|
||||
|
Citation/Reference Use constraints |
Please refer to the AMAP policy regarding use and reproduction of AMAP maps and graphics |
