The predicted (1988) average surface air sulfur dioxide concentrations in the Arctic

The predicted (1988) average surface air sulfur dioxide concentrations in the Arctic

(a) Vertical distribution of SOx (SO2 + SO42-) concentrations averaged over the area north of 75°N, and (b) contributions from the different sources

(a) Vertical distribution of SOx (SO2 + SO42-) concentrations averaged over the area north of 75°N, and (b) contributions from the different sources

Model calculations of ground level yearly average sulfur dioxide air concentration on the Kola Peninsula

Model calculations of ground level yearly average sulfur dioxide air concentration on the Kola Peninsula

Summer and winter visibility observations (for relative humidities less than 80%) for the period 1951 to 1993 in North America

Summer and winter visibility observations (for relative humidities less than 80%) for the period 1951 to 1993 in North America

The time series of light scattering (?sp) and optical depth (?) at 500 nm at Barrow, Alaska

The time series of light scattering (?sp) and optical depth (?) at 500 nm at Barrow, Alaska

Arctic surface air temperature

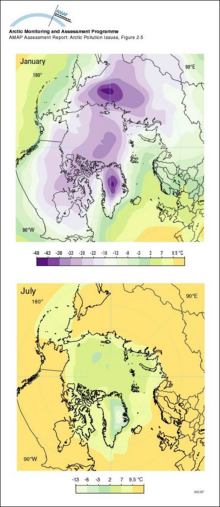
Mean January and July surface air temperatures (°C) in the Arctic
Arctic surface air temperature

Arctic sea-level atmospheric pressure (January)

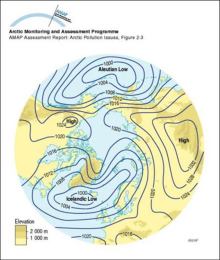
Mean atmospheric sea-level pressure (mb) in the Arctic in January
Arctic sea-level atmospheric pressure (January)

Deposition of PCBs, as mono/di/trichloro- and tetra-nonachlorobiphenyls) in snow cores from the Agassiz Ice Cap (northern Ellesmere Island, Canada) Combined light and dark shaded sections of each bar indicate sum-PCB flux

Deposition of PCBs, as mono/di/trichloro- and tetra-nonachlorobiphenyls) in snow cores from the Agassiz Ice Cap (northern Ellesmere Island, Canada) Combined light and dark shaded sections of each bar [..]
Deposition of PCBs, as mono/di/trichloro- and tetra-nonachlorobiphenyls) in snow cores from the Agassiz Ice Cap (northern Ellesmere Island, Canada) Combined light and dark shaded sections of each bar indicate sum-PCB flux

Temporal trends in concentrations of sum-HCH and toxaphene in Arctic air

Temporal trends in concentrations of sum-HCH and toxaphene in Arctic air

Temporal trends in PCB and DDT levels (µg/g lw ± 95% confidence limits) of otter muscle in Sweden Levels are based on means of 26, 16, and 28 samples (northern Sweden) and 29, 9, and 15 samples (southern Sweden)

Temporal trends in PCB and DDT levels (µg/g lw ± 95% confidence limits) of otter muscle in Sweden Levels are based on means of 26, 16, and 28 samples (northern Sweden) and 29, 9, and 15 samples [..]
Temporal trends in PCB and DDT levels (µg/g lw ± 95% confidence limits) of otter muscle in Sweden Levels are based on means of 26, 16, and 28 samples (northern Sweden) and 29, 9, and 15 samples (southern Sweden)

Historical profiles of PCBs (trichloro- and all other) in slices from dated sediment cores in Alaska, Canada, and Finland Median age of each slice is given on the vertical axis The green lines indicate the source function of PCBs

Historical profiles of PCBs (trichloro- and all other) in slices from dated sediment cores in Alaska, Canada, and Finland Median age of each slice is given on the vertical axis The green lines [..]
Historical profiles of PCBs (trichloro- and all other) in slices from dated sediment cores in Alaska, Canada, and Finland Median age of each slice is given on the vertical axis The green lines indicate the source function of PCBs

Temporal variation in cow milk Tag values for Sweden, Norway and Finland

Temporal variation in cow milk Tag values for Sweden, Norway and Finland

(a) The contribution from the different sources to the total deposition, averaged over the area north of 75°N from October 1990 to May 1994, (b) the calculated total monthly depositions of SOx averaged over the area north of 75°N, and (c) the

(a) The contribution from the different sources to the total deposition, averaged over the area north of 75°N from October 1990 to May 1994, (b) the calculated total monthly depositions of SOx [..]
(a) The contribution from the different sources to the total deposition, averaged over the area north of 75°N from October 1990 to May 1994, (b) the calculated total monthly depositions of SOx averaged over the area north of 75°N, and (c) the

Model calculations of total (wet and dry) deposition estimates of sulfur for 1988

Model calculations of total (wet and dry) deposition estimates of sulfur for 1988

Vertical distribution of Arctic haze in summer, winter, and the whole year Sulfur air concentrations and relative source-contribution (%) for different heights above the ground are shown The concentrations are averages over the Arctic area north of 70°N

Vertical distribution of Arctic haze in summer, winter, and the whole year Sulfur air concentrations and relative source-contribution (%) for different heights above the ground are shown The [..]
Vertical distribution of Arctic haze in summer, winter, and the whole year Sulfur air concentrations and relative source-contribution (%) for different heights above the ground are shown The concentrations are averages over the Arctic area north of 70°N


To refine your search you can combine your search strings with AND, OR, NOT and NEAR and phrases can be quoted:
water OR waste searches for either of these words
oceans AND biodiversity searches for blocks with both words
pollution NEAR water searches for blocks with either of these words, with them being closer ranks higher
"climate change" searches for this phrase