Your query returned 232 graphics.
Results 16 - 30
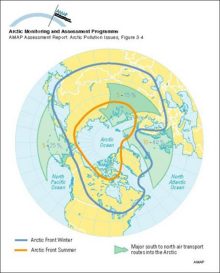
Arctic air masses and atmospheric transport routesThe mean position of the Arctic air mass in winter (January) and summer (July), superimposed on the (summer value % (orange) - winter value % (blue)) frequency of major south-to-north transport routes [..] |
|
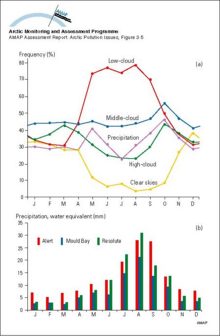
Cloud cover and precipitation in the Canadian High ArcticSeasonal variation in a) cloud cover and precipitation occurrence and b) precipitation amount in the Canadian High Arctic, 1951-1980 norms |
|
Atmosphere-surface exchangeSchematic diagram of processes of atmosphere-surface exchange |

|
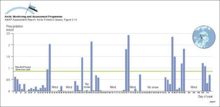
Precipitation rate measurements from Alert from January through April 1992 showing periods of no snow, periods of no snow measured due to wind events, and the relatively large quantities of precipitation on days duringPrecipitation rate measurements from Alert from January through April 1992 showing periods of no snow, periods of no snow measured due to wind events, and the relatively large quantities of [..] |
|
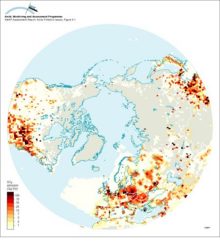
(a) Critical deposition of sulfur, and (b) its exceedance, in forest soils of northern Europe and Russia (5th percentile of the calculation points in each EMEP grid cell)(a) Critical deposition of sulfur, and (b) its exceedance, in forest soils of northern Europe and Russia (5th percentile of the calculation points in each EMEP grid cell) |

|
(a) Critical loads of acidity expressed as sulfur (5th percentile presented for each grid) for lakes in northern Fennoscandia and surface waters on Svalbard, and (b) their exceedance (95th percentile)(a) Critical loads of acidity expressed as sulfur (5th percentile presented for each grid) for lakes in northern Fennoscandia and surface waters on Svalbard, and (b) their exceedance (95th percentile) |

|
Anthropogenic SO2 emissions for 1985 north of 30°NAnthropogenic SO2 emissions for 1985 north of 30°N |
|
SMART model results for selected soil and lake output variables at Christmas lakes for the past 90 years and for three future scenarios assuming a 0%, 70% and 95% reduction of the present sulfur deposition levelsSMART model results for selected soil and lake output variables at Christmas lakes for the past 90 years and for three future scenarios assuming a 0%, 70% and 95% reduction of the present sulfur [..] |

|
MAGIC model results for the streamwater at Dalelva for the past 90 years and for three future scenarios assuming a 0%, 70%, and 95% reduction of the present sulfur deposition levelsMAGIC model results for the streamwater at Dalelva for the past 90 years and for three future scenarios assuming a 0%, 70%, and 95% reduction of the present sulfur deposition levels |

|
Snow cover over northern hemisphere lands between 1972 and 1996 for different seasons Values are determined from analyses of NOAA snow charts created using visible satellite imagerySnow cover over northern hemisphere lands between 1972 and 1996 for different seasons Values are determined from analyses of NOAA snow charts created using visible satellite imagery |

|
History of temperature changes in central Greenland over the last 40 000 years, from the GISP2 core, showing very large and probably abrupt changesHistory of temperature changes in central Greenland over the last 40 000 years, from the GISP2 core, showing very large and probably abrupt changes |

|
History of snow accumulation in central Greenland during the most recent glaciation, as measured in the GISP2 core The 25-year running mean, represented in all panels, shows very large and rapid climate changesHistory of snow accumulation in central Greenland during the most recent glaciation, as measured in the GISP2 core The 25-year running mean, represented in all panels, shows very large and rapid [..] |

|
Development of a type 1 ozone anomaly The series of satellite images show total column ozone for a period of days spanning 6-26 January 1996Development of a type 1 ozone anomaly The series of satellite images show total column ozone for a period of days spanning 6-26 January 1996 |

|
Trends in (annual average) ozone mixing ratio over Canada from 1980 to 1993Trends in (annual average) ozone mixing ratio over Canada from 1980 to 1993 |

|
Ozone soundings at Gardermoen, southern Norway, 27 January 1992 The green line denotes the partial pressure of ozone observed during the (type 1) anomaly, when low-ozone air passed over the areaOzone soundings at Gardermoen, southern Norway, 27 January 1992 The green line denotes the partial pressure of ozone observed during the (type 1) anomaly, when low-ozone air passed over the area |

|

water OR waste searches for either of these words
oceans AND biodiversity searches for blocks with both words
pollution NEAR water searches for blocks with either of these words, with them being closer ranks higher
"climate change" searches for this phrase