|
Scatterplots for comparisons between the average concentrations of SO2 and SO4 in air from October 1990 to December 1993 as monitored by the European Monitoring and Evaluation Programme (EMEP) and [..]
|

|
|
Calculated concentrations of SO2 and SO42- compared with measurements at Station Nord in northeastern Greenland
|

|
|
The predicted (1988) average surface air sulfate concentrations in the Arctic
|

|
|
The predicted (1988) average surface air sulfur dioxide concentrations in the Arctic
|

|
|
(a) Vertical distribution of SOx (SO2 + SO42-) concentrations averaged over the area north of 75°N, and (b) contributions from the different sources
|

|
|
Model calculations of ground level yearly average sulfur dioxide air concentration on the Kola Peninsula
|

|
|
Summer and winter visibility observations (for relative humidities less than 80%) for the period 1951 to 1993 in North America
|

|
|
The time series of light scattering (?sp) and optical depth (?) at 500 nm at Barrow, Alaska
|

|
|
Model calculations of total (wet and dry) deposition estimates of sulfur for 1988
|

|
|
Vertical distribution of Arctic haze in summer, winter, and the whole year Sulfur air concentrations and relative source-contribution (%) for different heights above the ground are shown The [..]
|

|
|
Monthly snow cover anomalies over northern hemispheric lands (including Greenland) between January 1972 and August 1995 Also shown are the 12-month running anomalies of hemispheric snow extent, [..]
|

|
|
Snow cover over northern hemisphere lands between 1972 and 1996 for different seasons Values are determined from analyses of NOAA snow charts created using visible satellite imagery
|

|
|
History of temperature changes in central Greenland over the last 40 000 years, from the GISP2 core, showing very large and probably abrupt changes
|

|
|
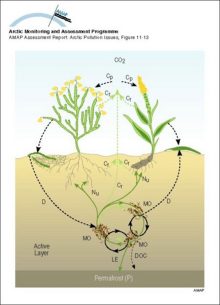
Schematic illustration of ecosystem carbon fluxes and nutrient circulation in the tundra Carbon and nutrient pathways are shown by dashed and continuous lines, respectively
|
|
|
History of snow accumulation in central Greenland during the most recent glaciation, as measured in the GISP2 core The 25-year running mean, represented in all panels, shows very large and rapid [..]
|

|

water OR waste searches for either of these words
oceans AND biodiversity searches for blocks with both words
pollution NEAR water searches for blocks with either of these words, with them being closer ranks higher
"climate change" searches for this phrase