|
The time series of light scattering (?sp) and optical depth (?) at 500 nm at Barrow, Alaska
|

|
|
Model calculations of total (wet and dry) deposition estimates of sulfur for 1988
|

|
|
Vertical distribution of Arctic haze in summer, winter, and the whole year Sulfur air concentrations and relative source-contribution (%) for different heights above the ground are shown The [..]
|

|
|
Development of a type 1 ozone anomaly The series of satellite images show total column ozone for a period of days spanning 6-26 January 1996
|

|
|
Trends in (annual average) ozone mixing ratio over Canada from 1980 to 1993
|

|
|
Ozone soundings at Gardermoen, southern Norway, 27 January 1992 The green line denotes the partial pressure of ozone observed during the (type 1) anomaly, when low-ozone air passed over the area
|

|
|
An example of a type 2 ozone anomaly, showing levels of ozone depletion relative to the long-term mean
|

|
|
Ozone soundings at Sodankylä, Finland, 23 March 1995 The green line denotes the profile of partial pressure of ozone observed during the (type 2) anomaly The red line shows the monthly mean ozone [..]
|

|
|
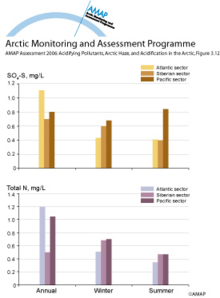
Annual and seasonal variations in average background levels of sulfate sulfur and total nitrogen in precipitation across the Atlantic, Siberian, and Pacific sectors of the Russian Arctic
|
|
|
Changes with time in 131I activity concentration in Finnish air samples
|
|
|
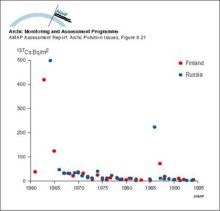
Changes with time in 137Cs activity concentration in air in Norway, Finland and Russia
|
|
|
Changes with time in wet and dry deposition of 137Cs in Arctic Finland and north west Russia (Nenets Autonomous Okrug)
|
|
|
Averaged upper (3000 m) air concentrations of Pb in winter (December-February) and summer (June-August) as modeled by the updated (1996) hemispheric EMEP transport model in a simulation for the [..]
|

|
|
Average contributions from various sources to the atmospheric concentrations of elements in winter air samples at Ny-Ålesund, Svalbard
|

|
|
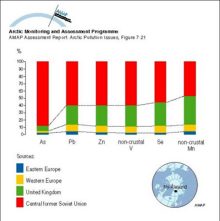
Average regional source apportionment of metals in winter aerosol at Ny-Ålesund, Svalbard from Europe and the central part of the former Soviet Union (including the Urals and Norilsk)
|
|

water OR waste searches for either of these words
oceans AND biodiversity searches for blocks with both words
pollution NEAR water searches for blocks with either of these words, with them being closer ranks higher
"climate change" searches for this phrase