Your query returned 135 graphics.
Results 91 - 105
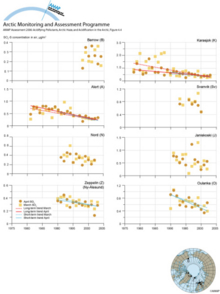
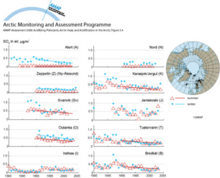
Monthly averaged sulfate concentrations for March and April at eight arctic monitoring sitesMonthly averaged sulfate concentrations for March and April at eight arctic monitoring sites and Sen’s slope estimates for the long term (approximately 1980 through the available data) and short term [..] |
|
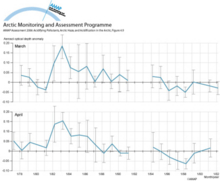
Monthly averaged aerosol optical depth anomalies at Barrow for March and AprilMonthly averaged aerosol optical depth anomalies at Barrow (Alaska) for March and April. The anomalies are relative to a base of non-volcanic years. Data from 1992 and 1993 were removed due to [..] |
|
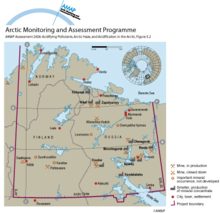
The Kola Ecoregion survey area and major industrial centersThe Kola Ecoregion survey area and major industrial centers |
|
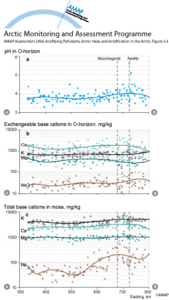
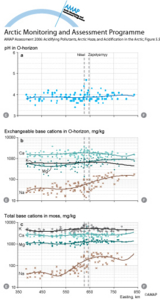
Transect west–east across the survey area and through the industrial zone centered on Monchegorsk and Apatity in 1995Transect west–east across the survey area and through the industrial zone centered on Monchegorsk and Apatity in 1995, showing: (a) pH in a water extract of the O-horizon of podzol soils; (b) [..] |
|
Transect west–east across the survey area and through the industrial zone centered on Nikel and Zapolyarnyy in 1995Transect west–east across the survey area and through the industrial zone centered on Nikel and Zapolyarnyy in 1995, showing (a) pH in a water extract of the O-horizon of podzol soils; (b) [..] |
|
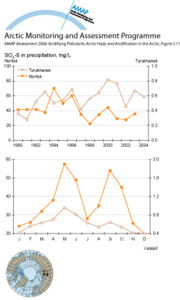
Annual and seasonal variations in sulfate sulfur concentrationsAnnual and seasonal variations in sulfate sulfur concentrations in an industrial area (Norilsk) and a background area (Turukhansk) of the Siberian sector of the Russian Arctic |
|
Trends in summer and winter total sulfate concentrations in air within the ArcticTrends in summer and winter total sulfate concentrations in air within the Arctic |
|
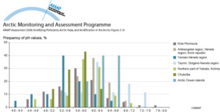
Acidity of snow cover across the Russian Arctic, 2001–2004Acidity of snow cover across the Russian Arctic, 2001–2004 |
|
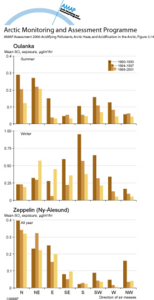
Mean exposure to sulfur dioxide at Oulanka and ZeppelinMean exposure to sulfur dioxide at Oulanka and Zeppelin in relation to the direction of air masses arriving at the stations in the 1990s |
|
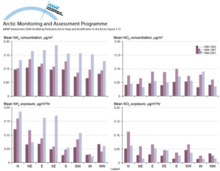
Mean concentration and exposure to nitrogen compounds at ZeppelinMean concentration and exposure to nitrogen compounds at Zeppelin in relation to the direction of air masses arriving at the station in the 1990s |
|
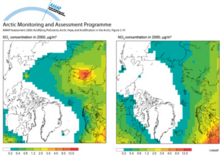
Mean surface air concentrations of sulfur oxidesMean surface air concentrations of sulfur oxides (i.e., sulfur dioxide plus sulfate) and nitrate in 2000 |
|
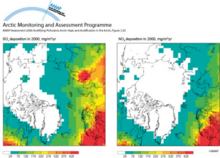
Total deposition of sulfur oxidesTotal deposition of sulfur oxides (i.e., sulfur dioxide plus sulfate) and nitrate in 2000 |
|
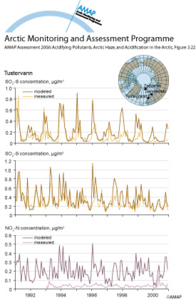
Time series of measured and modeled monthly concentrations of sulfur dioxide, sulfate, and nitrate at Tustervann , NorwayTime series of measured and modeled monthly concentrations of sulfur dioxide, sulfate, and nitrate at Tustervann , Norway |
|
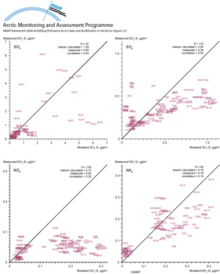
Scatterplots comparing measured and modeled annual average concentrations of sulfur dioxide, sulfate, nitrate and ammoniumScatterplots comparing measured and modeled annual average concentrations of sulfur dioxide, sulfate, nitrate and ammonium at arctic monitoring stations for 1991 to 2000. Labels on graphs refer to [..] |
|
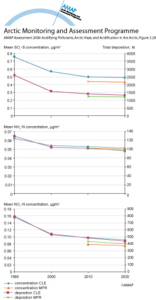
Total mean concentrations and total depositions of sulfur oxides, reduced nitrogen and airborne oxidized nitrogenTotal mean concentrations and total depositions of sulfur oxides, reduced nitrogen (NHX) and airborne oxidized nitrogen (NOy) for the area north of Arctic Circle for six emissions scenarios |
|

water OR waste searches for either of these words
oceans AND biodiversity searches for blocks with both words
pollution NEAR water searches for blocks with either of these words, with them being closer ranks higher
"climate change" searches for this phrase