Your query returned 166 graphics.
Results 76 - 90
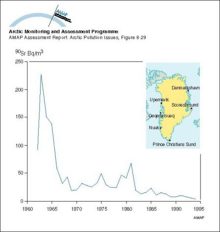
Changes with time in average activity concentration of 90Sr in drinking water in GreenlandChanges with time in average activity concentration of 90Sr in drinking water in Greenland |
|
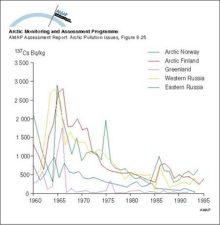
Changes with time in activity concentration of 137Cs in reindeer meat in Arctic Norway, Arctic Finland, Greenland, and Arctic RussiaChanges with time in activity concentration of 137Cs in reindeer meat in Arctic Norway, Arctic Finland, Greenland, and Arctic Russia |
|
Concentrations, as geometric means, of major organochlorine groups in burbot liver at Fort Good Hope, NWT, Canada (1986-94) Vertical bars denote standard errorsConcentrations, as geometric means, of major organochlorine groups in burbot liver at Fort Good Hope, NWT, Canada (1986-94) Vertical bars denote standard errors |

|
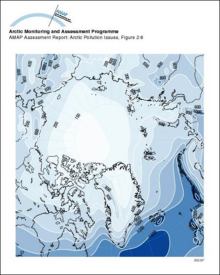
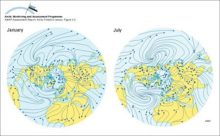
Arctic sea-level atmospheric pressure (July)Mean atmospheric sea-level pressure (mb) in the Arctic in July |
|
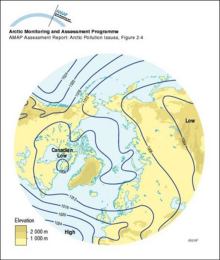
Precipitation in the ArcticDistribution of precipitation (mm/y) in the Arctic |
|
Arctic atmospheric circulationThe mean circulation of the lower atmosphere during January and July as depicted by mean streamlines of the resultant winds |
|
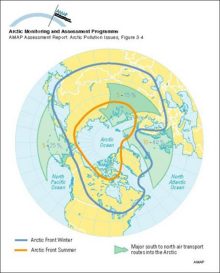
Arctic air masses and atmospheric transport routesThe mean position of the Arctic air mass in winter (January) and summer (July), superimposed on the (summer value % (orange) - winter value % (blue)) frequency of major south-to-north transport routes [..] |
|
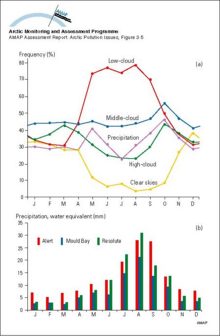
Cloud cover and precipitation in the Canadian High ArcticSeasonal variation in a) cloud cover and precipitation occurrence and b) precipitation amount in the Canadian High Arctic, 1951-1980 norms |
|
Atmosphere-surface exchangeSchematic diagram of processes of atmosphere-surface exchange |

|
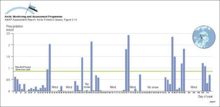
Precipitation rate measurements from Alert from January through April 1992 showing periods of no snow, periods of no snow measured due to wind events, and the relatively large quantities of precipitation on days duringPrecipitation rate measurements from Alert from January through April 1992 showing periods of no snow, periods of no snow measured due to wind events, and the relatively large quantities of [..] |
|
Distribution of organochlorine contaminants (OCs) in Arctic air, snow, seawater, and the marine mammals food chain Data for the six major classes of OCs are plotted for each compartment or species as the percent ofDistribution of organochlorine contaminants (OCs) in Arctic air, snow, seawater, and the marine mammals food chain Data for the six major classes of OCs are plotted for each compartment or species as [..] |

|
Concentrations of sum-HCH in Arctic airConcentrations of sum-HCH in Arctic air |

|
Source regions for HCH, chlordane, toxaphene, and PCBs in Arctic air based on 5-day back-trajectories for elevated air concentrations at Tagish, Alert, and Ny-ÅlesundSource regions for HCH, chlordane, toxaphene, and PCBs in Arctic air based on 5-day back-trajectories for elevated air concentrations at Tagish, Alert, and Ny-Ålesund |

|
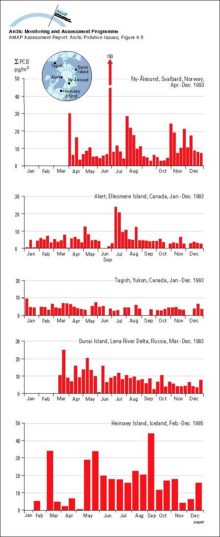
Concentrations of sum-PCB in Arctic air (sum of CBs 28, 31, 52, 101, 105, 118, 138, 153, 156, 180)Concentrations of sum-PCB in Arctic air (sum of CBs 28, 31, 52, 101, 105, 118, 138, 153, 156, 180) |
|
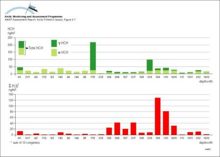
Flux of HCH and sum-PCB (sum of 10 congeners) in precipitation at Heimaey Island, IcelandFlux of HCH and sum-PCB (sum of 10 congeners) in precipitation at Heimaey Island, Iceland |
|

water OR waste searches for either of these words
oceans AND biodiversity searches for blocks with both words
pollution NEAR water searches for blocks with either of these words, with them being closer ranks higher
"climate change" searches for this phrase