Your query returned 65 graphics.
Results 31 - 45
Ozone soundings at Gardermoen, southern Norway, 27 January 1992 The green line denotes the partial pressure of ozone observed during the (type 1) anomaly, when low-ozone air passed over the areaOzone soundings at Gardermoen, southern Norway, 27 January 1992 The green line denotes the partial pressure of ozone observed during the (type 1) anomaly, when low-ozone air passed over the area |

|
An example of a type 2 ozone anomaly, showing levels of ozone depletion relative to the long-term meanAn example of a type 2 ozone anomaly, showing levels of ozone depletion relative to the long-term mean |

|
Ozone soundings at Sodankylä, Finland, 23 March 1995 The green line denotes the profile of partial pressure of ozone observed during the (type 2) anomaly The red line shows the monthly mean ozone profile for MarchOzone soundings at Sodankylä, Finland, 23 March 1995 The green line denotes the profile of partial pressure of ozone observed during the (type 2) anomaly The red line shows the monthly mean ozone [..] |

|
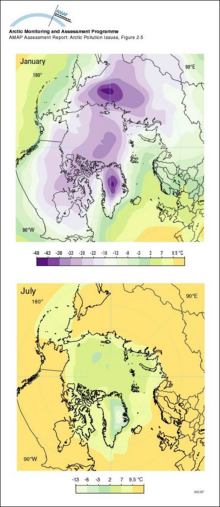
Arctic surface air temperatureMean January and July surface air temperatures (°C) in the Arctic |
|
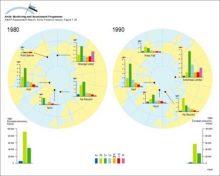
Winter concentrations of metals in air at remote locations in the Arctic at the beginning of the 1980s and 1990s, and European emissions of As, Pb and Zn during the same periodsWinter concentrations of metals in air at remote locations in the Arctic at the beginning of the 1980s and 1990s, and European emissions of As, Pb and Zn during the same periods |
|
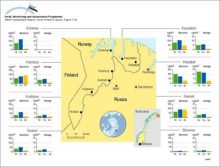
Average (15-month) and 24-h average maximum air concentrations of Ni, Cu and As measured at several stations in northern Norway near to major point sources on the Kola PeninsulaAverage (15-month) and 24-h average maximum air concentrations of Ni, Cu and As measured at several stations in northern Norway near to major point sources on the Kola Peninsula |
|
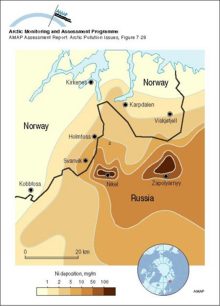
Nickel deposition to snow on the Kola Peninsula in April 1990Nickel deposition to snow on the Kola Peninsula in April 1990 |
|
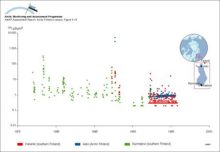
Changes with time in 131I activity concentration in Finnish air samplesChanges with time in 131I activity concentration in Finnish air samples |
|
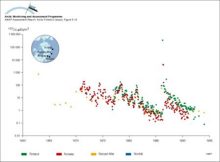
Changes with time in 137Cs activity concentration in air in Norway, Finland and RussiaChanges with time in 137Cs activity concentration in air in Norway, Finland and Russia |
|
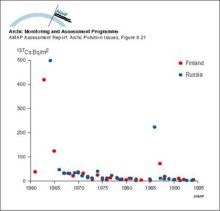
Changes with time in wet and dry deposition of 137Cs in Arctic Finland and north west Russia (Nenets Autonomous Okrug)Changes with time in wet and dry deposition of 137Cs in Arctic Finland and north west Russia (Nenets Autonomous Okrug) |
|
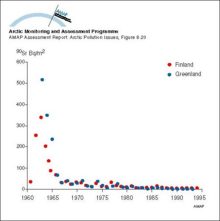
Changes with time in wet and dry deposition of 90Sr in Arctic Finland and GreenlandChanges with time in wet and dry deposition of 90Sr in Arctic Finland and Greenland |
|
The time series of (a) weekly-averaged non-seasalt (nss) sulfate aerosol at Alert, NWT, Canada, (b) monthly-averaged sulfate aerosol at Ny Ålesund, Norway, (c) weekly-averaged nitrate at Alert, and (d) weekly-averaged hydrogen ion at AlertThe time series of (a) weekly-averaged non-seasalt (nss) sulfate aerosol at Alert, NWT, Canada, (b) monthly-averaged sulfate aerosol at Ny Ålesund, Norway, (c) weekly-averaged nitrate at Alert, and [..] |

|
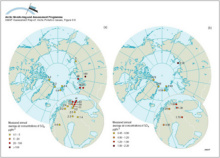
(a) Yearly average sulfur dioxide air concentration measurements in the Arctic, (b) Yearly average sulfate air concentration measurements in the Arctic(a) Yearly average sulfur dioxide air concentration measurements in the Arctic, (b) Yearly average sulfate air concentration measurements in the Arctic |
|
Emission rates of sulfur dioxide from Nikel together with annual average SO2 air concentrations measured at two sites in Norway (1978-1992)Emission rates of sulfur dioxide from Nikel together with annual average SO2 air concentrations measured at two sites in Norway (1978-1992) |

|
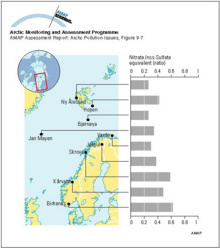
Variation of the nitrate to non-seasalt (nss) sulfate equivalent ratio in precipitation at Norwegian recording stations based on measurements between August 1982 and July 1984Variation of the nitrate to non-seasalt (nss) sulfate equivalent ratio in precipitation at Norwegian recording stations based on measurements between August 1982 and July 1984 |
|

water OR waste searches for either of these words
oceans AND biodiversity searches for blocks with both words
pollution NEAR water searches for blocks with either of these words, with them being closer ranks higher
"climate change" searches for this phrase