Your query returned 65 graphics.
Results 46 - 60
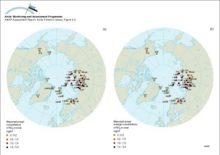
Concentrations of (a) sulfate and (b) nitrate in snowConcentrations of (a) sulfate and (b) nitrate in snow |
|
Scatterplots for comparisons between the average concentrations of SO2 and SO4 in air from October 1990 to December 1993 as monitored by the European Monitoring and Evaluation Programme (EMEP) and calculated by Christensen (1996)Scatterplots for comparisons between the average concentrations of SO2 and SO4 in air from October 1990 to December 1993 as monitored by the European Monitoring and Evaluation Programme (EMEP) and [..] |

|
Calculated concentrations of SO2 and SO42- compared with measurements at Station Nord in northeastern GreenlandCalculated concentrations of SO2 and SO42- compared with measurements at Station Nord in northeastern Greenland |

|
The predicted (1988) average surface air sulfate concentrations in the ArcticThe predicted (1988) average surface air sulfate concentrations in the Arctic |

|
The predicted (1988) average surface air sulfur dioxide concentrations in the ArcticThe predicted (1988) average surface air sulfur dioxide concentrations in the Arctic |

|
(a) Vertical distribution of SOx (SO2 + SO42-) concentrations averaged over the area north of 75°N, and (b) contributions from the different sources(a) Vertical distribution of SOx (SO2 + SO42-) concentrations averaged over the area north of 75°N, and (b) contributions from the different sources |

|
Model calculations of ground level yearly average sulfur dioxide air concentration on the Kola PeninsulaModel calculations of ground level yearly average sulfur dioxide air concentration on the Kola Peninsula |

|
Summer and winter visibility observations (for relative humidities less than 80%) for the period 1951 to 1993 in North AmericaSummer and winter visibility observations (for relative humidities less than 80%) for the period 1951 to 1993 in North America |

|
The time series of light scattering (?sp) and optical depth (?) at 500 nm at Barrow, AlaskaThe time series of light scattering (?sp) and optical depth (?) at 500 nm at Barrow, Alaska |

|
Model calculations of total (wet and dry) deposition estimates of sulfur for 1988Model calculations of total (wet and dry) deposition estimates of sulfur for 1988 |

|
Vertical distribution of Arctic haze in summer, winter, and the whole year Sulfur air concentrations and relative source-contribution (%) for different heights above the ground are shown The concentrations are averages over the Arctic area north of 70°NVertical distribution of Arctic haze in summer, winter, and the whole year Sulfur air concentrations and relative source-contribution (%) for different heights above the ground are shown The [..] |

|
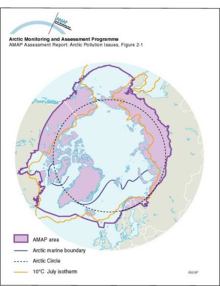
Arctic boundaries (physical)The Arctic as defined by temperature, and the Arctic marine boundary, also showing the boundary of the AMAP assessment area |
|
An example of a positive feedback loop Warming leads to a decrease in sea ice cover which in turn leads to a decrease in albedo over the ocean, the result of which is further warming and further decreases in the sea ice coverAn example of a positive feedback loop Warming leads to a decrease in sea ice cover which in turn leads to a decrease in albedo over the ocean, the result of which is further warming and further [..] |

|
The hydrologic balance in the Arctic is highly dynamic on the seasonal time scale with large and rapid ice melts in the spring On land, this ice and snow melting results in large rapid floods and surges in riversThe hydrologic balance in the Arctic is highly dynamic on the seasonal time scale with large and rapid ice melts in the spring On land, this ice and snow melting results in large rapid floods and [..] |

|
MAGIC model results for the streamwater at Dalelva for the past 90 years and for three future scenarios assuming a 0%, 70%, and 95% reduction of the present sulfur deposition levelsMAGIC model results for the streamwater at Dalelva for the past 90 years and for three future scenarios assuming a 0%, 70%, and 95% reduction of the present sulfur deposition levels |

|

water OR waste searches for either of these words
oceans AND biodiversity searches for blocks with both words
pollution NEAR water searches for blocks with either of these words, with them being closer ranks higher
"climate change" searches for this phrase