Your query returned 54 graphics.
Results 16 - 30
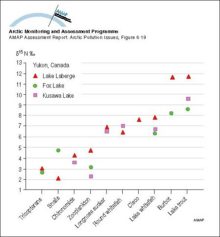
Mean delta-15 nitrogen (ppt) for invertebrates and fish collected from Laberge, Fox, and Kusawa LakesMean delta-15 nitrogen (ppt) for invertebrates and fish collected from Laberge, Fox, and Kusawa Lakes |
|
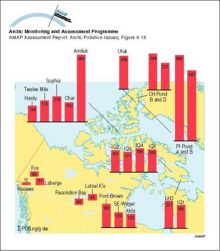
Geographic trends of sum-PCBs in zooplankton (>100 µm) in northern Canadian lakes All concentrations in ng/g dwGeographic trends of sum-PCBs in zooplankton (>100 µm) in northern Canadian lakes All concentrations in ng/g dw |
|
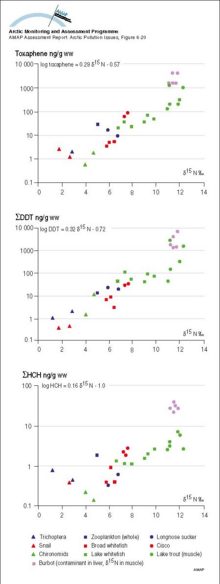
delta-15 Nitrogen isotope ratios versus Toxaphene, DDT, and HCH for fish and invertebrates from Lake Laberge, Yukon Territorydelta-15 Nitrogen isotope ratios versus Toxaphene, DDT, and HCH for fish and invertebrates from Lake Laberge, Yukon Territory |
|
Changes with time in 137Cs contamination in the food chain lichen - reindeer - humansChanges with time in 137Cs contamination in the food chain lichen - reindeer - humans |

|
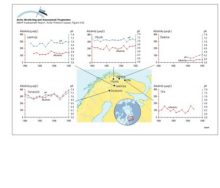
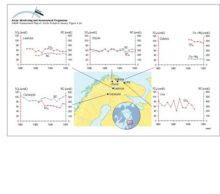
Annual average of alkalinity and pH as measured in rivers in northern Fennoscandia and the Kola PeninsulaAnnual average of alkalinity and pH as measured in rivers in northern Fennoscandia and the Kola Peninsula |
|
Annual average of sulfate and base cation concentrations as measured in rivers in northern Fennoscandia and the Kola Peninsula Note: SO4 (non-seasalt) estimated for river Utsjoki from total sulfurAnnual average of sulfate and base cation concentrations as measured in rivers in northern Fennoscandia and the Kola Peninsula Note: SO4 (non-seasalt) estimated for river Utsjoki from total sulfur |
|
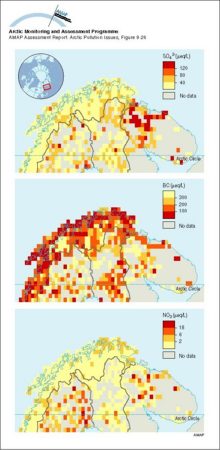
Median concentrations of sulfate, base cations, and nitrate in lakes of northern Fennoscandia and the Kola PeninsulaMedian concentrations of sulfate, base cations, and nitrate in lakes of northern Fennoscandia and the Kola Peninsula |
|
(a) Critical loads of acidity expressed as sulfur (5th percentile presented for each grid) for lakes in northern Fennoscandia and surface waters on Svalbard, and (b) their exceedance (95th percentile)(a) Critical loads of acidity expressed as sulfur (5th percentile presented for each grid) for lakes in northern Fennoscandia and surface waters on Svalbard, and (b) their exceedance (95th percentile) |

|
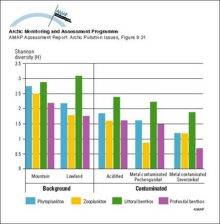
Diversity indices (Shannon-Weaver means) for phytoplankton, zooplankton and zoobenthos in lakes and streams in the Murmansk regionDiversity indices (Shannon-Weaver means) for phytoplankton, zooplankton and zoobenthos in lakes and streams in the Murmansk region |
|
SMART model results for selected soil and lake output variables at Christmas lakes for the past 90 years and for three future scenarios assuming a 0%, 70% and 95% reduction of the present sulfur deposition levelsSMART model results for selected soil and lake output variables at Christmas lakes for the past 90 years and for three future scenarios assuming a 0%, 70% and 95% reduction of the present sulfur [..] |

|
MAGIC model results for the streamwater at Dalelva for the past 90 years and for three future scenarios assuming a 0%, 70%, and 95% reduction of the present sulfur deposition levelsMAGIC model results for the streamwater at Dalelva for the past 90 years and for three future scenarios assuming a 0%, 70%, and 95% reduction of the present sulfur deposition levels |

|
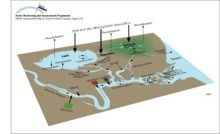
Conceptual model of the terrestrial/freshwater compartment showing the main subcompartments and contaminant transfers, and exchanges with the atmosphere and oceansConceptual model of the terrestrial/freshwater compartment showing the main subcompartments and contaminant transfers, and exchanges with the atmosphere and oceans |
|
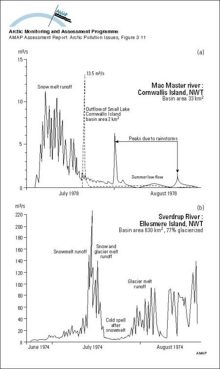
Hydrographs showing two types of streamflow regimes for Arctic rivers: a) Arctic nival regime and b) proglacial regimeHydrographs showing two types of streamflow regimes for Arctic rivers: a) Arctic nival regime and b) proglacial regime |
|
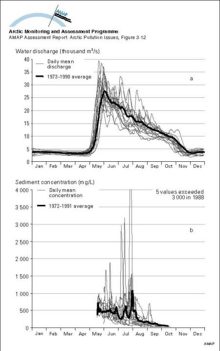
a) The annual (1973-1990) and mean annual hydrographs for the Mackenzie River above the Arctic Red River, NWT, Canada, indicating the dominance of the spring freshet in Maya) The annual (1973-1990) and mean annual hydrographs for the Mackenzie River above the Arctic Red River, NWT, Canada, indicating the dominance of the spring freshet in May |
|
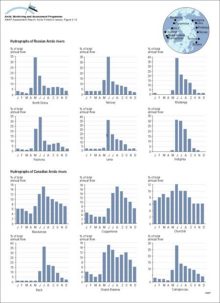
Monthly mean discharge expressed as a percent of annual discharge from available data for selected Russian and Canadian rivers draining to the ArcticMonthly mean discharge expressed as a percent of annual discharge from available data for selected Russian and Canadian rivers draining to the Arctic |
|

water OR waste searches for either of these words
oceans AND biodiversity searches for blocks with both words
pollution NEAR water searches for blocks with either of these words, with them being closer ranks higher
"climate change" searches for this phrase