|
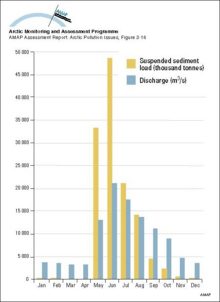
Comparison of monthly water and suspended sediment loads to the Mackenzie Delta plain for the period 1974-1983
|
|
|
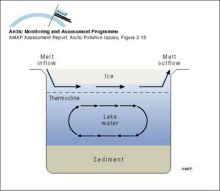
Illustration of the movement of less dense spring freshet water moving through a small Arctic lake underneath the surface ice cover, but not mixing with the water column
|
|
|
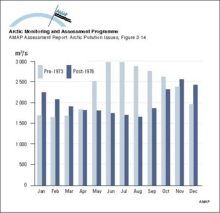
Monthly mean discharges for the Nelson River, Canada for the period 1960 to regulation in 1973, compared to post-regulation discharges from 1976 to 1990
|
|
|
Concentrations, as geometric means, of major organochlorine groups in burbot liver at Fort Good Hope, NWT, Canada (1986-94) Vertical bars denote standard errors
|

|
|
Temporal trends in levels of PCB, DDT, alpha-HCH, and HCB in muscle from Lake Storvindeln pike and Lake Abiskojaure char in Sweden Mean levels (µg/g lw) and 95% confidence intervals of the mean are [..]
|

|
|
Levels of PCB congeners and PCDD/Fs (ng/g lw) in Lake Storvindeln pike muscle between 1968 and 1992
|

|
|
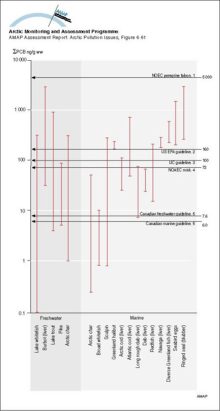
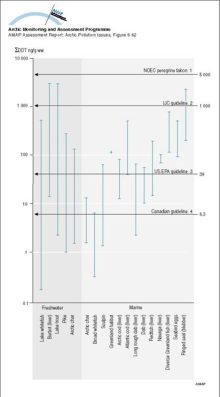
Sum-PCB (ng/g ww) in Arctic animals as food items compared to no-effect-concentrations (NOAEC) and environmental quality guidelines for protecting fish-eating/aquatic wildlife (1 Baril et al 1990, 2 [..]
|
|
|
Sum-DDT (ng/g ww) in Arctic animals as food items compared to no-effect-concentrations (NOAEC) and environmental quality guidelines for protecting fish-eating/aquatic wildlife (1 Baril et al 1990, 2 [..]
|
|
|
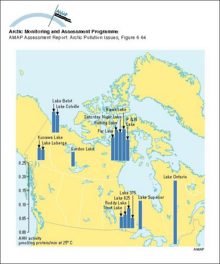
AHH induction in lake trout from Canada
|
|
|
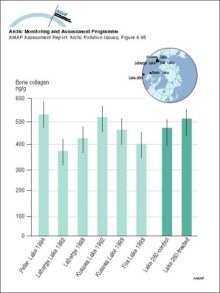
Comparison of bone collagen in lake trout from Peter Lake, NWT and from Yukon lakes, and in toxaphene- treated and control fish from Lake 260
|
|
|
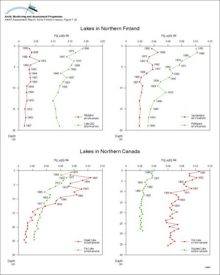
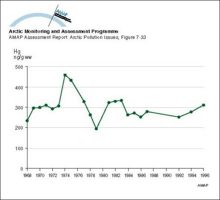
Concentrations of Hg in dated sediment cores from lakes in Arctic Finland and Canada
|
|
|
Changes with time in (weight adjusted, geometric mean) concentrations of Hg in muscle tissue of pike (Esox lucius) in Sweden
|
|
|
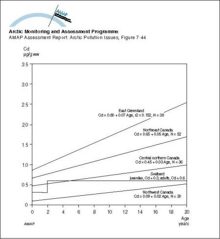
Age accumulation of Cd in liver of polar bears from different Arctic regions
|
|
|
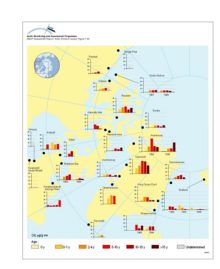
Distribution of Cd levels in liver tissue of ringed seal (Phoca hispida) of different ages Plots show selected data (geometric mean values) from Annex Table 7A15
|
|
|
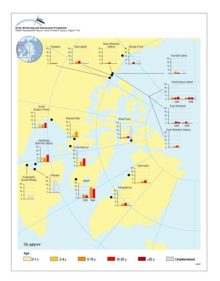
Distribution of Cd levels in liver tissue of beluga whale (Delphinapterus leucas) of different ages Plots show selected data (geometric mean values) from Annex Table 7A15
|
|

water OR waste searches for either of these words
oceans AND biodiversity searches for blocks with both words
pollution NEAR water searches for blocks with either of these words, with them being closer ranks higher
"climate change" searches for this phrase