Your query returned 175 graphics.
Results 16 - 30
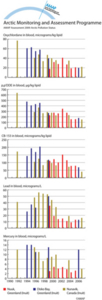
Concentrations, as geometric means, of major organochlorine groups in burbot liver at Fort Good Hope, NWT, Canada (1986-94) Vertical bars denote standard errorsConcentrations, as geometric means, of major organochlorine groups in burbot liver at Fort Good Hope, NWT, Canada (1986-94) Vertical bars denote standard errors |

|
Temporal trends in levels of PCB, DDT, alpha-HCH, and HCB in muscle from Lake Storvindeln pike and Lake Abiskojaure char in Sweden Mean levels (µg/g lw) and 95% confidence intervals of the mean are represented by dark points,Temporal trends in levels of PCB, DDT, alpha-HCH, and HCB in muscle from Lake Storvindeln pike and Lake Abiskojaure char in Sweden Mean levels (µg/g lw) and 95% confidence intervals of the mean are [..] |

|
Temporal trends in PCB and DDE levels in Arctic seabird eggs from Prince Leopold Island, Canada (1975-1993)Temporal trends in PCB and DDE levels in Arctic seabird eggs from Prince Leopold Island, Canada (1975-1993) |

|
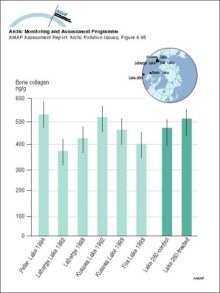
Comparison of bone collagen in lake trout from Peter Lake, NWT and from Yukon lakes, and in toxaphene- treated and control fish from Lake 260Comparison of bone collagen in lake trout from Peter Lake, NWT and from Yukon lakes, and in toxaphene- treated and control fish from Lake 260 |
|
Spatial distribution of emissions of Pb within the 150 km x 150 km EMEP grid system for the area north of latitude 50° N in 1989Spatial distribution of emissions of Pb within the 150 km x 150 km EMEP grid system for the area north of latitude 50° N in 1989 |

|
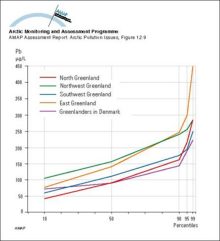
Distribution (in percentiles) of whole blood lead concentrations in four regions in Greenland and in Greenlanders living in DenmarkDistribution (in percentiles) of whole blood lead concentrations in four regions in Greenland and in Greenlanders living in Denmark |
|
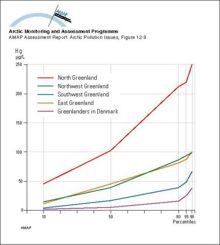
Distribution (in percentiles) of whole blood mercury concentrations in four regions in Greenland and in Greenlanders living in DenmarkDistribution (in percentiles) of whole blood mercury concentrations in four regions in Greenland and in Greenlanders living in Denmark |
|
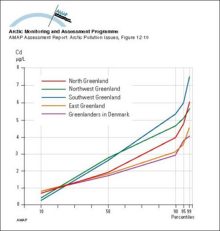
Distribution (in percentiles) of whole blood cadmium concentrations in four regions in Greenland and in Greenlanders living in DenmarkDistribution (in percentiles) of whole blood cadmium concentrations in four regions in Greenland and in Greenlanders living in Denmark |
|
Temporal trends of POPs and metals in maternal blood samples from Nunavik, CanadaTemporal trends of POPs and metals in maternal blood samples from Nunavik, Canada |

|
Temporal trends of POPs and metals in maternal blood samples from Nuuk and Disko Bay, GreenlandTemporal trends of POPs and metals in maternal blood samples from Nuuk and Disko Bay, Greenland |

|
Changes over time in levels of legacy POPs and metals in blood of pregnant women from three communities in Greenland and CanadaChanges over time in levels of legacy POPs and metals in blood of pregnant women from three communities in Greenland and Canada |
|
Conceptual model of the terrestrial/freshwater compartment showing the main subcompartments and contaminant transfers, and exchanges with the atmosphere and oceansConceptual model of the terrestrial/freshwater compartment showing the main subcompartments and contaminant transfers, and exchanges with the atmosphere and oceans |
|
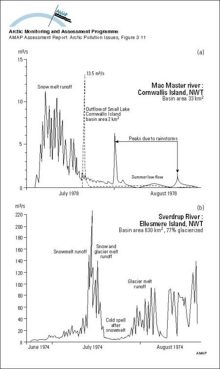
Hydrographs showing two types of streamflow regimes for Arctic rivers: a) Arctic nival regime and b) proglacial regimeHydrographs showing two types of streamflow regimes for Arctic rivers: a) Arctic nival regime and b) proglacial regime |
|
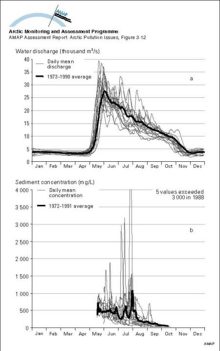
a) The annual (1973-1990) and mean annual hydrographs for the Mackenzie River above the Arctic Red River, NWT, Canada, indicating the dominance of the spring freshet in Maya) The annual (1973-1990) and mean annual hydrographs for the Mackenzie River above the Arctic Red River, NWT, Canada, indicating the dominance of the spring freshet in May |
|
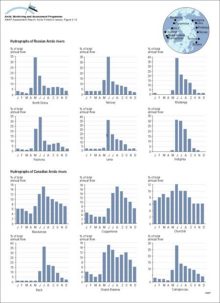
Monthly mean discharge expressed as a percent of annual discharge from available data for selected Russian and Canadian rivers draining to the ArcticMonthly mean discharge expressed as a percent of annual discharge from available data for selected Russian and Canadian rivers draining to the Arctic |
|

water OR waste searches for either of these words
oceans AND biodiversity searches for blocks with both words
pollution NEAR water searches for blocks with either of these words, with them being closer ranks higher
"climate change" searches for this phrase