|
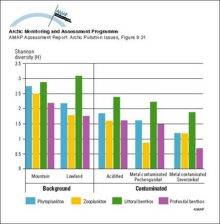
Diversity indices (Shannon-Weaver means) for phytoplankton, zooplankton and zoobenthos in lakes and streams in the Murmansk region
|
|
|
SMART model results for selected soil and lake output variables at Christmas lakes for the past 90 years and for three future scenarios assuming a 0%, 70% and 95% reduction of the present sulfur [..]
|

|
|
MAGIC model results for the streamwater at Dalelva for the past 90 years and for three future scenarios assuming a 0%, 70%, and 95% reduction of the present sulfur deposition levels
|

|
|
Monthly snow cover anomalies over northern hemispheric lands (including Greenland) between January 1972 and August 1995 Also shown are the 12-month running anomalies of hemispheric snow extent, [..]
|

|
|
Snow cover over northern hemisphere lands between 1972 and 1996 for different seasons Values are determined from analyses of NOAA snow charts created using visible satellite imagery
|

|
|
History of temperature changes in central Greenland over the last 40 000 years, from the GISP2 core, showing very large and probably abrupt changes
|

|
|
History of snow accumulation in central Greenland during the most recent glaciation, as measured in the GISP2 core The 25-year running mean, represented in all panels, shows very large and rapid [..]
|

|
|
Trends in (annual average) ozone mixing ratio over Canada from 1980 to 1993
|

|
|
Body burdens of radiocaesium (yearly averages) across the Canadian Arctic
|

|
|
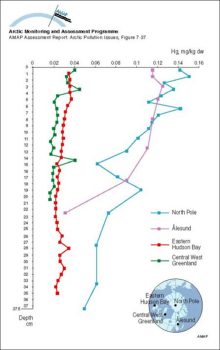
Concentrations of Hg in Arctic marine sediment cores
|
|
|
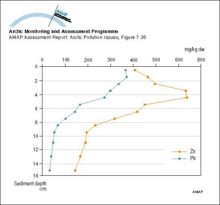
Lead and zinc in a sediment core sampled in 1991, 15 km from the Black Angel mine in West Greenland
|
|
|
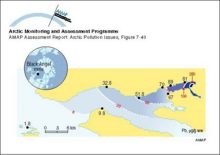
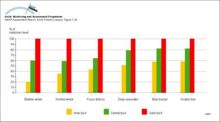
Lead levels in blue mussels (Mytilus edulis) in the fjord outside the Black Angel lead-zinc mine in West Greenland in 1986-87 Values on the fjord coast are measured concentrations Estimated [..]
|
|
|
Local differences in Cd concentrations in sedentary and stationary algae and biota from Nuuk and Uummannaq fjords, central West Greenland Levels are plotted as the percentage of the maximum [..]
|
|
|
Temporal trend of Pb concentrations in growing tips of seaweed (Fucus vesiculosus) at the Black Angel lead-zinc mine in West Greenland The background value is estimated to be 02 µg/g dw
|

|
|
Temporal trend of Pb concentrations in liver tissue of spotted wolffish (Anarhichas minor) at the Black Angel lead-zinc mine in West Greenland
|

|

water OR waste searches for either of these words
oceans AND biodiversity searches for blocks with both words
pollution NEAR water searches for blocks with either of these words, with them being closer ranks higher
"climate change" searches for this phrase