|
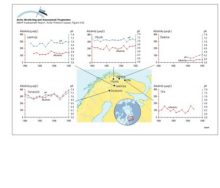
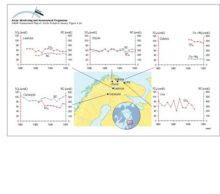
The time series of light scattering (?sp) and optical depth (?) at 500 nm at Barrow, Alaska
|

|
|
Annual average of alkalinity and pH as measured in rivers in northern Fennoscandia and the Kola Peninsula
|
|
|
Annual average of sulfate and base cation concentrations as measured in rivers in northern Fennoscandia and the Kola Peninsula Note: SO4 (non-seasalt) estimated for river Utsjoki from total sulfur
|
|
|
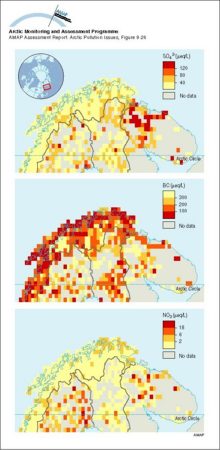
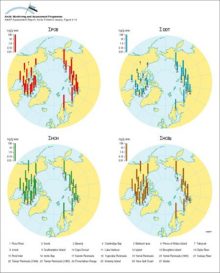
Median concentrations of sulfate, base cations, and nitrate in lakes of northern Fennoscandia and the Kola Peninsula
|
|
|
(a) Critical loads of acidity expressed as sulfur (5th percentile presented for each grid) for lakes in northern Fennoscandia and surface waters on Svalbard, and (b) their exceedance (95th percentile)
|

|
|
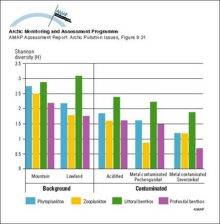
Diversity indices (Shannon-Weaver means) for phytoplankton, zooplankton and zoobenthos in lakes and streams in the Murmansk region
|
|
|
SMART model results for selected soil and lake output variables at Christmas lakes for the past 90 years and for three future scenarios assuming a 0%, 70% and 95% reduction of the present sulfur [..]
|

|
|
MAGIC model results for the streamwater at Dalelva for the past 90 years and for three future scenarios assuming a 0%, 70%, and 95% reduction of the present sulfur deposition levels
|

|
|
Monthly snow cover anomalies over northern hemispheric lands (including Greenland) between January 1972 and August 1995 Also shown are the 12-month running anomalies of hemispheric snow extent, [..]
|

|
|
Snow cover over northern hemisphere lands between 1972 and 1996 for different seasons Values are determined from analyses of NOAA snow charts created using visible satellite imagery
|

|
|
History of temperature changes in central Greenland over the last 40 000 years, from the GISP2 core, showing very large and probably abrupt changes
|

|
|
History of snow accumulation in central Greenland during the most recent glaciation, as measured in the GISP2 core The 25-year running mean, represented in all panels, shows very large and rapid [..]
|

|
|
Trends in (annual average) ozone mixing ratio over Canada from 1980 to 1993
|

|
|
Relative tissue concentrations of organochlorine compounds detected in lichen, and in adipose tissue of caribou and wolf at three locations in the Northwest Territories, Canada
|

|
|
Observed and predicted organochlorine concentrations (ng/g ww) in caribou and reindeer (Rangifer tarandus) liver All data are presented in, or were derived from data in Annex Table 6A4
|
|

water OR waste searches for either of these words
oceans AND biodiversity searches for blocks with both words
pollution NEAR water searches for blocks with either of these words, with them being closer ranks higher
"climate change" searches for this phrase