Your query returned 164 graphics.
Results 31 - 45
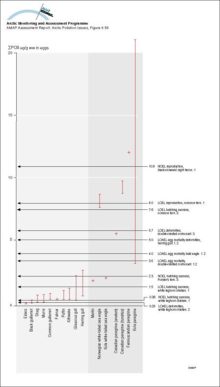
Concentrations of sum-PCB (µg/g ww) in Arctic bird eggs compared to thresholds for avian effects (1 Barron et al 1995, 2 Giesy et al 1994b, 3 Bosveld and Van den Berg 1994)Concentrations of sum-PCB (µg/g ww) in Arctic bird eggs compared to thresholds for avian effects (1 Barron et al 1995, 2 Giesy et al 1994b, 3 Bosveld and Van den Berg 1994) |
|
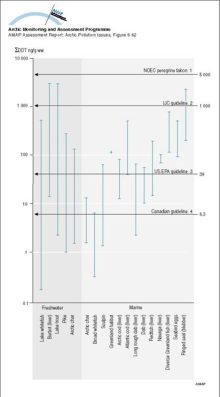
Sum-DDT (ng/g ww) in Arctic animals as food items compared to no-effect-concentrations (NOAEC) and environmental quality guidelines for protecting fish-eating/aquatic wildlife (1 Baril et al 1990, 2 USEPA 1995,Sum-DDT (ng/g ww) in Arctic animals as food items compared to no-effect-concentrations (NOAEC) and environmental quality guidelines for protecting fish-eating/aquatic wildlife (1 Baril et al 1990, 2 [..] |
|
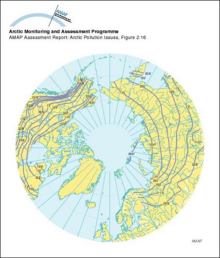
River break-up in the ArcticMean dates of river break-up in the Arctic; month number in Roman numerals |
|
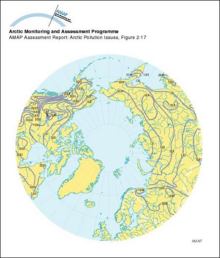
River freeze-up in the ArcticMean dates of river freeze-up in the Arctic |
|
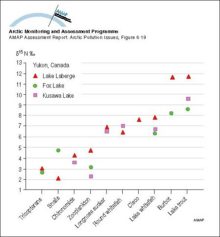
Mean delta-15 nitrogen (ppt) for invertebrates and fish collected from Laberge, Fox, and Kusawa LakesMean delta-15 nitrogen (ppt) for invertebrates and fish collected from Laberge, Fox, and Kusawa Lakes |
|
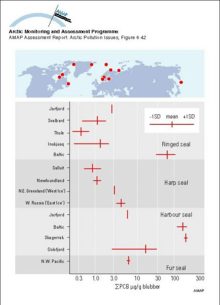
Comparison of sum-PCB concentrations in seal blubber from various Arctic regions with results from the same species in temperate waters Vertical bars represent means and the horizontal bars the standard deviation, where availableComparison of sum-PCB concentrations in seal blubber from various Arctic regions with results from the same species in temperate waters Vertical bars represent means and the horizontal bars the [..] |
|
Temporal trends in OC levels (ng/g lw) in reindeer from Abisko, Sweden Levels are usually based on a pool of 10 samplesTemporal trends in OC levels (ng/g lw) in reindeer from Abisko, Sweden Levels are usually based on a pool of 10 samples |

|
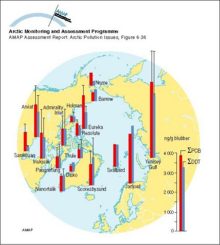
Sum-PCB and sum-DDT in ringed seal blubber (µg/g) Vertical bars denote standard deviationSum-PCB and sum-DDT in ringed seal blubber (µg/g) Vertical bars denote standard deviation |
|
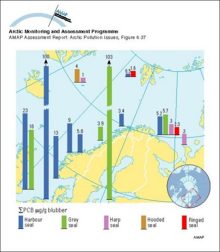
Sum-PCB levels in pinnipeds in NorwaySum-PCB levels in pinnipeds in Norway |
|
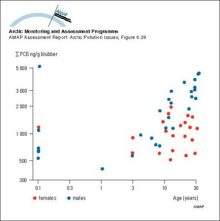
Variation of PCB with age in blubber of ringed seals (western Hudson Bay, Canada) A total of 24 females and 30 males were analyzedVariation of PCB with age in blubber of ringed seals (western Hudson Bay, Canada) A total of 24 females and 30 males were analyzed |
|
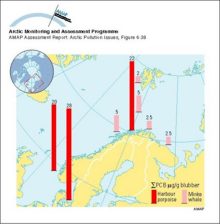
Sum-PCB levels in cetaceans in NorwaySum-PCB levels in cetaceans in Norway |
|
Correlations between concentrations (lw) of major persistent OCs and trophic level in the marine food web for Svalbard and Lancaster Sound Trophic level data were assigned based on Hobson and Welch (1992)Correlations between concentrations (lw) of major persistent OCs and trophic level in the marine food web for Svalbard and Lancaster Sound Trophic level data were assigned based on Hobson and Welch [..] |

|
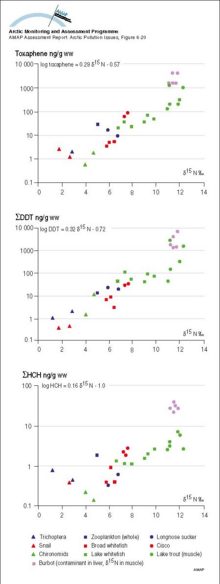
delta-15 Nitrogen isotope ratios versus Toxaphene, DDT, and HCH for fish and invertebrates from Lake Laberge, Yukon Territorydelta-15 Nitrogen isotope ratios versus Toxaphene, DDT, and HCH for fish and invertebrates from Lake Laberge, Yukon Territory |
|
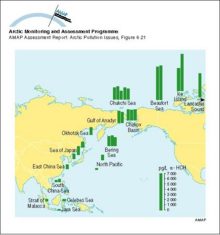
alpha-HCH (ng/L) in seawater: an illustration of the cold condensation effectalpha-HCH (ng/L) in seawater: an illustration of the cold condensation effect |
|
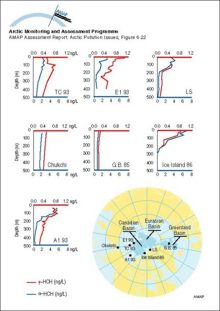
Vertical profiles of HCH for the Arctic OceanVertical profiles of HCH for the Arctic Ocean |
|

water OR waste searches for either of these words
oceans AND biodiversity searches for blocks with both words
pollution NEAR water searches for blocks with either of these words, with them being closer ranks higher
"climate change" searches for this phrase