|
Illustration of the concept of a) the 'zone of influence' through major contaminant pathways from a major source region, and b) the 'contaminant focussing zone' resulting from the convergence of [..]
|

|
|
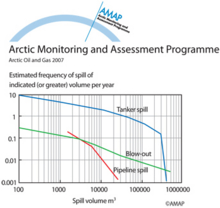
Relationship between frequency and volume of releases to the marine environment from different sources (worldwide)
|
|
|
A comparison of the structures of the Bergen, Toronto, and Combined zonally-averaged global models
|
|
|
Distribution of radioactivity (PCi/L) in the surface layer of the ocean after ten years of simulation of Preller's model Source locations are the Ob, Yenisey and Pechora Rivers, as well as Sellafield
|
|
|
Yearly and depth-averaged concentrations (Bq/m3) of 137Cs after 6 years from Harms' model The sources are instantaneous releases of 1 PBq from the dump sites in Abrosimov Bay, Stepovogo Bay, Tsivolky [..]
|
|
|
Vertically integrated tracer burden shown after 15 years Units are burden per unit surface area, normalized by cumulative release Bottom topography is in meters; a) no neptune, centered difference, [..]
|
|
|
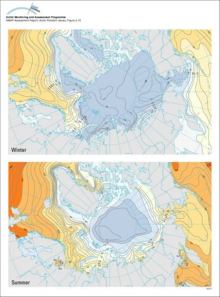
Winter and summer surface water temperatures (°C) in the Arctic Ocean and adjacent seas
|
|
|
Winter and summer surface water salinity in the Arctic Ocean and adjacent seas
|

|
|
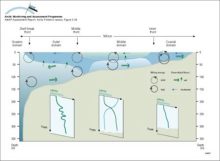
The different domains of the Bering Sea continental shelf are separated by fronts The coastal domain (depth <50m) tends to be vertically homogeneous, the middle domain (50-100m) shows a clear [..]
|
|
|
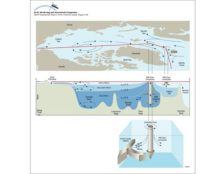
Circulation and water mass structure in the Arctic Ocean and Nordic Seas Mixing processes, such as brine formation, result in denser water that is transported off the shelves and into the deep basin
|
|
|
Schematic representation of the temperature and salinity structure of the upper Arctic Ocean and how the halocline layer is maintained by brine-rich water produced on the shelves
|

|
|
Schematic diagram of the Combined Model Ten climatic zones, each containing well-mixed compartments, are connected by meridional atmospheric and oceanic exchange
|
|
|
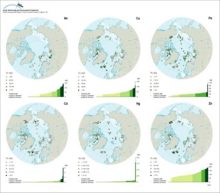
Concentrations of metals in fine-grained surface marine sediments in the Arctic
|
|
|
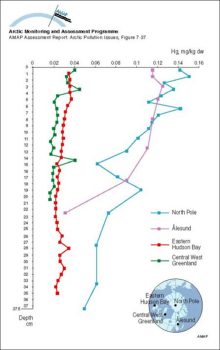
Concentrations of Hg in Arctic marine sediment cores
|
|
|
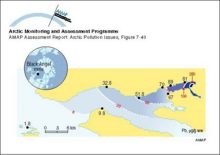
Lead levels in blue mussels (Mytilus edulis) in the fjord outside the Black Angel lead-zinc mine in West Greenland in 1986-87 Values on the fjord coast are measured concentrations Estimated [..]
|
|

water OR waste searches for either of these words
oceans AND biodiversity searches for blocks with both words
pollution NEAR water searches for blocks with either of these words, with them being closer ranks higher
"climate change" searches for this phrase