|
Vertical distribution of Arctic haze in summer, winter, and the whole year Sulfur air concentrations and relative source-contribution (%) for different heights above the ground are shown The [..]
|

|
|
SMART model results for selected soil and lake output variables at Christmas lakes for the past 90 years and for three future scenarios assuming a 0%, 70% and 95% reduction of the present sulfur [..]
|

|
|
MAGIC model results for the streamwater at Dalelva for the past 90 years and for three future scenarios assuming a 0%, 70%, and 95% reduction of the present sulfur deposition levels
|

|
|
Norwegian counties considered in the flux vulnerability case study
|
|
|
Relative 137Cs output in foodstuffs from the different Arctic Norwegian counties in the first year after an assumed uniform deposition of 100 kBq/m2
|

|
|
The comparative importance of different foodstuffs as sources of 137Cs for the three Arctic Norwegian counties over the 1-year and 50-year period following an assumed uniform deposition of 100 kBq/m2
|

|
|
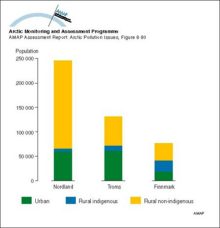
Distribution of the population of the three Arctic Norwegian counties
|
|
|
Scatterplots for comparisons between the average concentrations of SO2 and SO4 in air from October 1990 to December 1993 as monitored by the European Monitoring and Evaluation Programme (EMEP) and [..]
|

|
|
Calculated concentrations of SO2 and SO42- compared with measurements at Station Nord in northeastern Greenland
|

|
|
The predicted (1988) average surface air sulfate concentrations in the Arctic
|

|
|
The predicted (1988) average surface air sulfur dioxide concentrations in the Arctic
|

|
|
An example of a positive feedback loop Warming leads to a decrease in sea ice cover which in turn leads to a decrease in albedo over the ocean, the result of which is further warming and further [..]
|

|
|
The hydrologic balance in the Arctic is highly dynamic on the seasonal time scale with large and rapid ice melts in the spring On land, this ice and snow melting results in large rapid floods and [..]
|

|

water OR waste searches for either of these words
oceans AND biodiversity searches for blocks with both words
pollution NEAR water searches for blocks with either of these words, with them being closer ranks higher
"climate change" searches for this phrase