|
Temperature and salinity of the Labrador Sea The cold freshwater from the Arctic Ocean and Baffin Bay is seen above the continental shelf
|

|
|
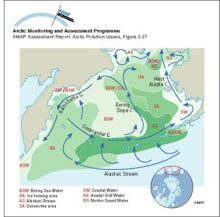
Schematic diagram of circulation and the extent of different water masses in the Bering Sea
|
|
|
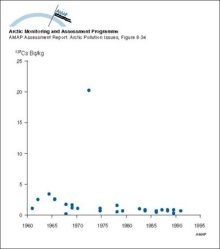
Changes with time in 137Cs activity concentration in whales from Greenland waters
|
|
|
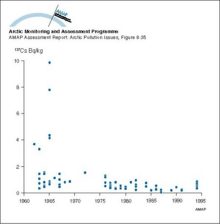
Changes with time in 137Cs activity concentration in seals from Greenland waters
|
|
|
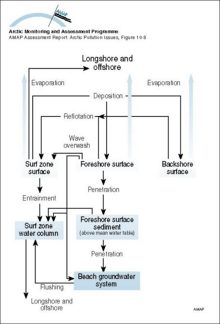
Mass transport pathways considered in the Coastal Zone Oil Spill Model (COZOIL), developed to simulate dynamic transport and weathering of oil on US Arctic coasts
|
|
|
Locations of sea dumping of radioactive waste in the Russian Arctic
|

|
|
Changes with time in 137Cs contamination in the food chain lichen - reindeer - humans
|

|
|
Temporal variation in calculated reindeer Tag values for different Arctic regions
|

|
|
Spatial trends in the net flux from reindeer meat in different Arctic areas, for the first year after an assumed uniform deposition of 100 kBq/m2
|

|
|
Temporal variation in cow milk Tag values for Sweden, Norway and Finland
|

|
|
Comparison of the predicted flux of 137Cs in milk and reindeer meat in different Arctic areas, for the first year after an assumed uniform deposition of 100 kBq/m2
|

|
|
(a) Vertical distribution of SOx (SO2 + SO42-) concentrations averaged over the area north of 75°N, and (b) contributions from the different sources
|

|
|
Summer and winter visibility observations (for relative humidities less than 80%) for the period 1951 to 1993 in North America
|

|
|
(a) The contribution from the different sources to the total deposition, averaged over the area north of 75°N from October 1990 to May 1994, (b) the calculated total monthly depositions of SOx [..]
|

|
|
(a) Trajectories of five satellite-tracked buoys launched in Mackenzie Bay, Canada, and (b) results of 30-day trajectories of oil launched from five hypothetical spill locations in the Beaufort Sea
|

|

water OR waste searches for either of these words
oceans AND biodiversity searches for blocks with both words
pollution NEAR water searches for blocks with either of these words, with them being closer ranks higher
"climate change" searches for this phrase