|
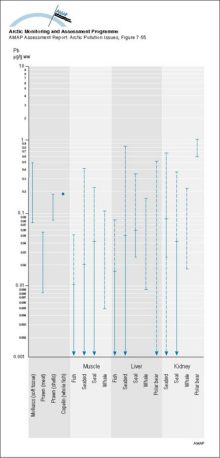
Summary of ranges of Pb levels (mean values) in Arctic marine organisms Solid parts of the lines indicate ranges for Greenlandic data
|
|
|
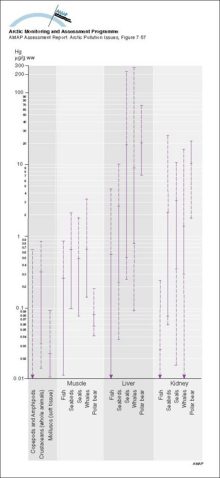
Summary of ranges of Hg levels (mean values) in Arctic marine organisms Solid parts of the lines indicate ranges for Greenlandic data
|
|
|
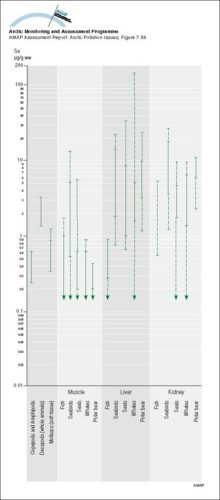
Summary of ranges of Se levels (mean values) in Arctic marine organisms Solid parts of the lines indicate ranges for Greenlandic data
|
|
|
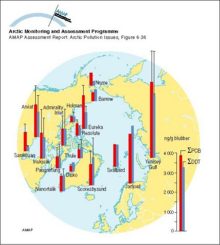
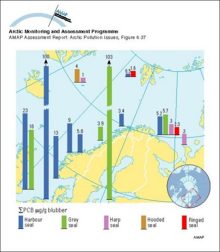
Sum-PCB and sum-DDT in ringed seal blubber (µg/g) Vertical bars denote standard deviation
|
|
|
Sum-PCB levels in pinnipeds in Norway
|
|
|
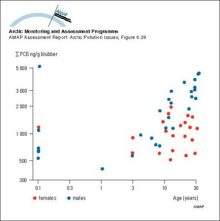
Variation of PCB with age in blubber of ringed seals (western Hudson Bay, Canada) A total of 24 females and 30 males were analyzed
|
|
|
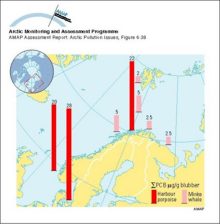
Sum-PCB levels in cetaceans in Norway
|
|
|
Correlations between concentrations (lw) of major persistent OCs and trophic level in the marine food web for Svalbard and Lancaster Sound Trophic level data were assigned based on Hobson and Welch [..]
|

|
|
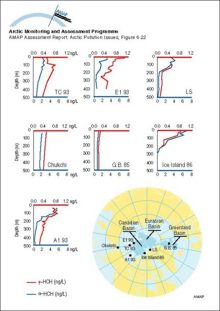
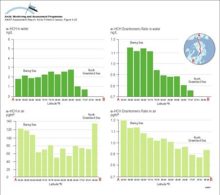
Vertical profiles of HCH for the Arctic Ocean
|
|
|
Trends in alpha-HCH and enantiomer ratios (ER) on a transect from the Bering Sea across the polar cap to the Greenland Sea during the Arctic Ocean Transect Study of July and August 1994
|
|
|
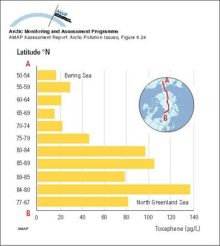
Measurements of toxaphene in surface water in the Bering Sea (1993) and the transpolar cruise (1994)
|
|
|
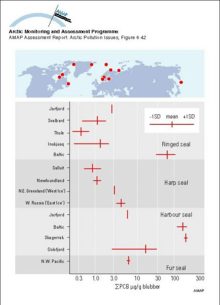
Comparison of sum-PCB concentrations in seal blubber from various Arctic regions with results from the same species in temperate waters Vertical bars represent means and the horizontal bars the [..]
|
|
|
Temporal trends in OC levels (ng/g lw) in reindeer from Abisko, Sweden Levels are usually based on a pool of 10 samples
|

|
|
Deposition of PCBs, as mono/di/trichloro- and tetra-nonachlorobiphenyls) in snow cores from the Agassiz Ice Cap (northern Ellesmere Island, Canada) Combined light and dark shaded sections of each bar [..]
|

|
|
Temporal trends in concentrations of sum-HCH and toxaphene in Arctic air
|

|

water OR waste searches for either of these words
oceans AND biodiversity searches for blocks with both words
pollution NEAR water searches for blocks with either of these words, with them being closer ranks higher
"climate change" searches for this phrase