|
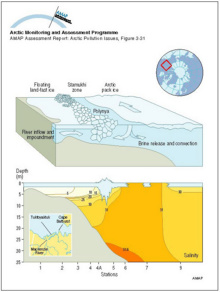
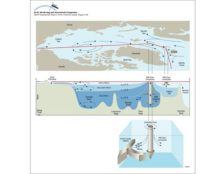
A schematic diagram showing the inflow from the Mackenzie River trapped in the nearshore zone beneath the landfast ice Beyond the stamukhi zone, intermittent opening and refreezing in the flaw lead [..]
|
|
|
Distribution of potential temperature, salinity, and density across the Arctic Ocean and the Greenland and Norwegian Seas
|

|
|
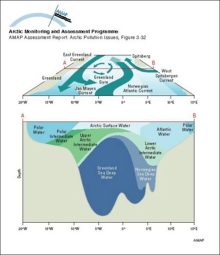
Schematic diagrams of the Greenland Sea showing the surface circulation (above) and water mass structure at a section across the central gyre (below)
|
|
|
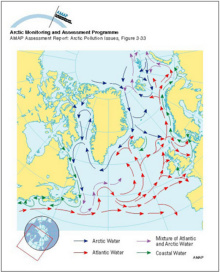
Major surface currents in the North Atlantic Ocean
|
|
|
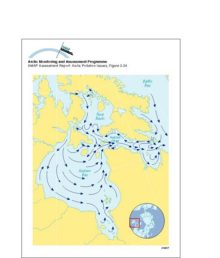
Surface currents in Hudson Bay, Hudson Strait and Foxe Basin
|
|
|
Transport of 90Sr, originating from Sellafield, along the coast of Norway The highest values are found in the Norwegian Coastal Current and decrease northward
|

|
|
Temperature and salinity of the Labrador Sea The cold freshwater from the Arctic Ocean and Baffin Bay is seen above the continental shelf
|

|
|
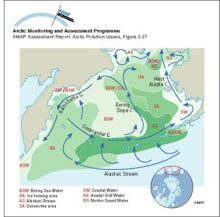
Schematic diagram of circulation and the extent of different water masses in the Bering Sea
|
|
|
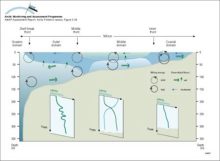
The different domains of the Bering Sea continental shelf are separated by fronts The coastal domain (depth <50m) tends to be vertically homogeneous, the middle domain (50-100m) shows a clear [..]
|
|
|
Circulation and water mass structure in the Arctic Ocean and Nordic Seas Mixing processes, such as brine formation, result in denser water that is transported off the shelves and into the deep basin
|
|
|
Schematic representation of the temperature and salinity structure of the upper Arctic Ocean and how the halocline layer is maintained by brine-rich water produced on the shelves
|

|
|
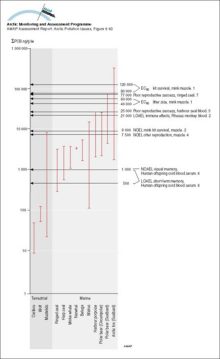
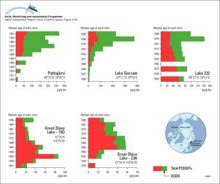
Sum-PCB (ng/g lw) in Arctic mammals compared to thresholds for mammalian effects (1 Leonards et al 1995, 2 Tryphonas 1994, 3 Kihlström et al 1992, 4 Olsson et al 1996a, 5 Boon et al 1987, 6 Ahlborg et [..]
|
|
|
Concentration (pg/g dw) profiles for octachlorodioxin (OCDD) and total PCDD/Fs in dated sediment cores from Arctic Canada and Finland Sum-PCDD/Fs = sum of 2,3,7,8-substituted tetra- to octachloro D/Fs [..]
|
|
|
Tracer concentration on a vertical section (along Y=0 on Figure 346) after 15 years; a) no neptune, centered difference; b) neptune, flux-corrected transport; c,d) velocity normal to the section with [..]
|

|
|
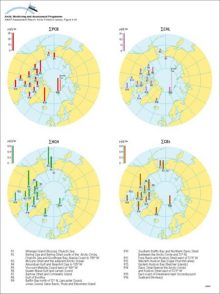
Organochlorine levels in polar bear adipose tissues (µg/g lw), adjusted to levels expected in 11-year-old males (after correction for age and sex), for sum-PCB, sum-CHL, sum-HCH, and sum-CBz, and in [..]
|
|

water OR waste searches for either of these words
oceans AND biodiversity searches for blocks with both words
pollution NEAR water searches for blocks with either of these words, with them being closer ranks higher
"climate change" searches for this phrase