|
Distribution of organochlorine contaminants (OCs) in Arctic air, snow, seawater, and the marine mammals food chain Data for the six major classes of OCs are plotted for each compartment or species as [..]
|

|
|
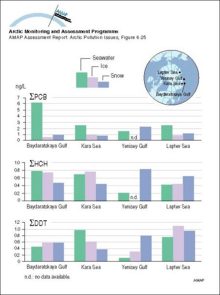
Concentrations of sum-PCB, sum-HCH, and sum-DDT in seawater, ice, and overlying snow collected at approximately the same locations in the Russian Arctic in 1993-95
|
|
|
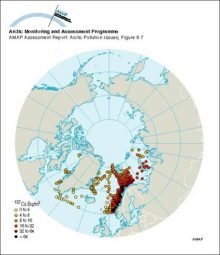
Cs-137 activity concentrations in surface seawater in 1979 and 1982
|
|
|
Seawater concentrations of 137Cs in the Barents and East Greenland Seas compared to the yearly releases from Sellafield
|

|
|
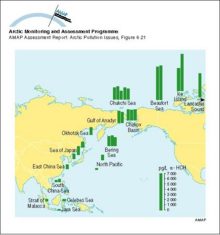
alpha-HCH (ng/L) in seawater: an illustration of the cold condensation effect
|
|
|
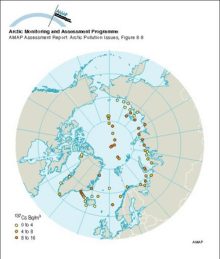
Cs-137 activity concentrations in surface seawater in 1994
|
|
|
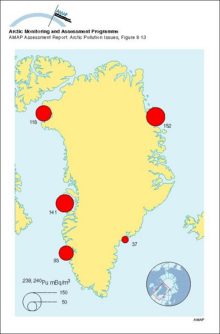
Concentrations of 239,240Pu in seawater around Greenland, 1968
|
|
|
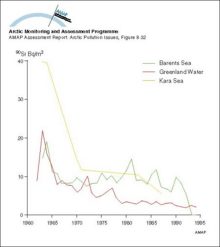
Changes with time in 90Sr activity concentrations in surface seawater from Greenland waters and the Barents and Kara Seas
|
|
|
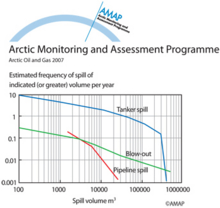
Relationship between frequency and volume of releases to the marine environment from different sources (worldwide)
|
|
|
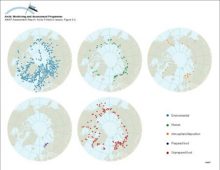
Geographical distribution of sample information in the AMAP radioactivity database
|
|
|
Available data in the AMAP radioactivity database as a function of time
|
|
|
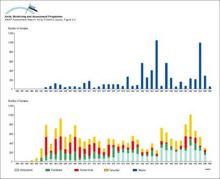
Ranges and average values of 137Cs activity concentrations in food products, from data in the AMAP radioactivity database
|

|
|
Distribution of radioactivity (PCi/L) in the surface layer of the ocean after ten years of simulation of Preller's model Source locations are the Ob, Yenisey and Pechora Rivers, as well as Sellafield
|

|
|
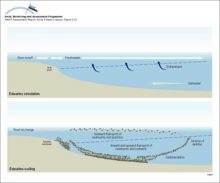
Illustration of water, sediment and nutrient cycling in estuaries Freshwater flows outward, transporting sediments, plankton and also contaminants Material that sinks into the inflowing seawater may [..]
|
|
|
Schematic representation of shelf processes involving transport of contaminants and sea ice
|

|

water OR waste searches for either of these words
oceans AND biodiversity searches for blocks with both words
pollution NEAR water searches for blocks with either of these words, with them being closer ranks higher
"climate change" searches for this phrase