|
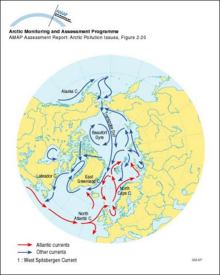
Surface ocean currents in the Arctic
|
|
|
Conceptual model of the coastal zone and marine environments showing the main subcompartments and contaminant transfers, and exchanges with the atmosphere
|

|
|
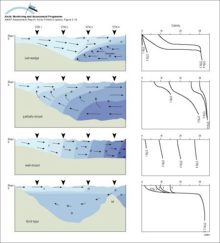
Basic circulation and salinity distribution in salt wedge, partially-mixed, well-mixed and fjord-type estuaries as defined by Wollast and Duinker (1982) Numbers and shading show salinity values
|
|
|
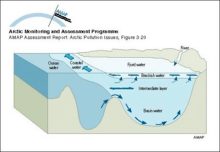
Sketch of main circulation pattern in a fjord
|
|
|
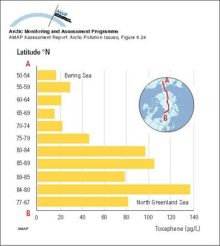
Measurements of toxaphene in surface water in the Bering Sea (1993) and the transpolar cruise (1994)
|
|
|
Time series of emissions of SO2 from European sources (Mylona 1993) and two major sources on the Kola Peninsula
|

|
|
The time series of (a) weekly-averaged non-seasalt (nss) sulfate aerosol at Alert, NWT, Canada, (b) monthly-averaged sulfate aerosol at Ny Ålesund, Norway, (c) weekly-averaged nitrate at Alert, and [..]
|

|
|
Emission rates of sulfur dioxide from Nikel together with annual average SO2 air concentrations measured at two sites in Norway (1978-1992)
|

|
|
Historical records of a) NO3- and b) SO42- concentrations from the Greenland icecap at Dye 3 c) A comparison of trends in the average SO42- and SO42- plus NO3- concentrations at Dye 3 in Greenland [..]
|

|
|
Calculated concentrations of SO2 and SO42- compared with measurements at Station Nord in northeastern Greenland
|

|
|
The time series of light scattering (?sp) and optical depth (?) at 500 nm at Barrow, Alaska
|

|
|
SMART model results for selected soil and lake output variables at Christmas lakes for the past 90 years and for three future scenarios assuming a 0%, 70% and 95% reduction of the present sulfur [..]
|

|
|
Monthly snow cover anomalies over northern hemispheric lands (including Greenland) between January 1972 and August 1995 Also shown are the 12-month running anomalies of hemispheric snow extent, [..]
|

|
|
Snow cover over northern hemisphere lands between 1972 and 1996 for different seasons Values are determined from analyses of NOAA snow charts created using visible satellite imagery
|

|
|
History of temperature changes in central Greenland over the last 40 000 years, from the GISP2 core, showing very large and probably abrupt changes
|

|

water OR waste searches for either of these words
oceans AND biodiversity searches for blocks with both words
pollution NEAR water searches for blocks with either of these words, with them being closer ranks higher
"climate change" searches for this phrase