|
Vertically integrated tracer burden shown after 15 years Units are burden per unit surface area, normalized by cumulative release Bottom topography is in meters; a) no neptune, centered difference, [..]
|

|
|
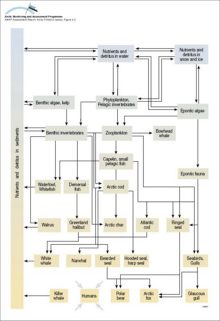
Generalized marine food web
|
|
|
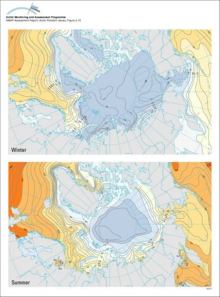
Winter and summer surface water temperatures (°C) in the Arctic Ocean and adjacent seas
|
|
|
Winter and summer surface water salinity in the Arctic Ocean and adjacent seas
|

|
|
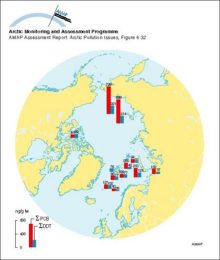
Sum-PCB and sum-DDT (ng/g lw) in Arctic cod liver, 1994-95
|
|
|
PCB and toxaphene (ng/g ww) in zooplankton from the transpolar cruise of the Arctic Ocean, July-September 1994
|
|
|
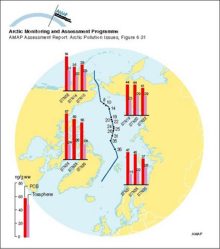
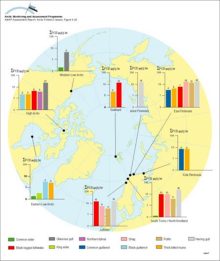
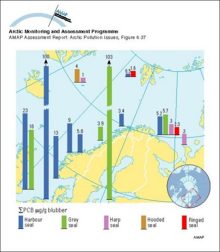
Geographical trends of PCB and DDT in harp seals from Arctic waters Vertical bars represent arithmetic means ± SD of combined results for males and females The SD has been estimated from the range in [..]
|
|
|
Levels of PCBs in seabird eggs (µg/g lw) Values written above bars are actual mean concentrations Wet weight means are given in Annex Table 6A16
|
|
|
Migration patterns of four main stocks of eider ducks from the Canadian Arctic Organochlorines in the same four stocks
|
|
|
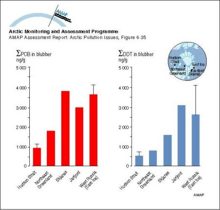
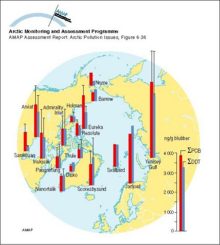
Sum-PCB and sum-DDT in ringed seal blubber (µg/g) Vertical bars denote standard deviation
|
|
|
Sum-PCB levels in pinnipeds in Norway
|
|
|
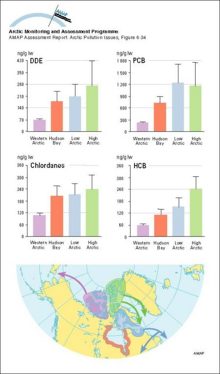
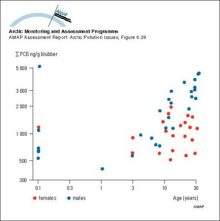
Variation of PCB with age in blubber of ringed seals (western Hudson Bay, Canada) A total of 24 females and 30 males were analyzed
|
|
|
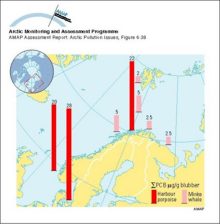
Sum-PCB levels in cetaceans in Norway
|
|
|
Correlations between concentrations (lw) of major persistent OCs and trophic level in the marine food web for Svalbard and Lancaster Sound Trophic level data were assigned based on Hobson and Welch [..]
|

|
|
Concentrations, as geometric means, of major organochlorine groups in burbot liver at Fort Good Hope, NWT, Canada (1986-94) Vertical bars denote standard errors
|

|

water OR waste searches for either of these words
oceans AND biodiversity searches for blocks with both words
pollution NEAR water searches for blocks with either of these words, with them being closer ranks higher
"climate change" searches for this phrase