Your query returned 153 graphics.
Results 136 - 150
Dose estimates based on wholebody measurements (see Figure 836) for two groups (northern Saami and southern Saami) of Norwegian reindeer-breeding SaamiDose estimates based on wholebody measurements (see Figure 836) for two groups (northern Saami and southern Saami) of Norwegian reindeer-breeding Saami |

|
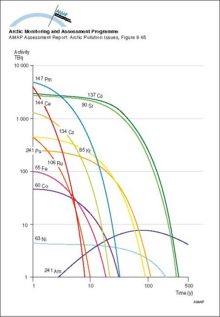
The changing inventory of major radionuclides in the Komsomolets reactor with timeThe changing inventory of major radionuclides in the Komsomolets reactor with time |
|
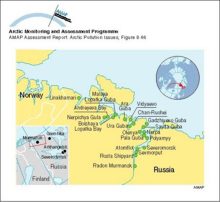
Major Russian naval bases along the Kola Peninsula and White SeaMajor Russian naval bases along the Kola Peninsula and White Sea |
|
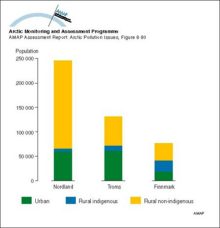
Distribution of the population of the three Arctic Norwegian countiesDistribution of the population of the three Arctic Norwegian counties |
|
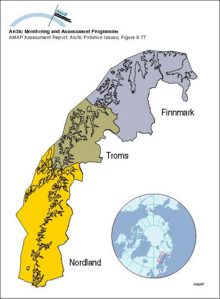
Norwegian counties considered in the flux vulnerability case studyNorwegian counties considered in the flux vulnerability case study |
|
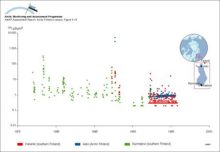
Temporal variation in cow milk Tag values for Sweden, Norway and FinlandTemporal variation in cow milk Tag values for Sweden, Norway and Finland |

|
Predicted release rates of different radionuclide groups from the submarine reactor dumped in the Novaya Zemlya Trough (best estimate scenario)Predicted release rates of different radionuclide groups from the submarine reactor dumped in the Novaya Zemlya Trough (best estimate scenario) |

|
Temporal variation in calculated reindeer Tag values for different Arctic regionsTemporal variation in calculated reindeer Tag values for different Arctic regions |

|
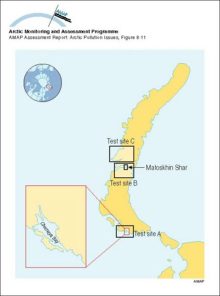
Nuclear weapons test sites on Novaya ZemlyaNuclear weapons test sites on Novaya Zemlya |
|
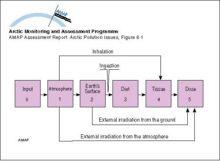
Compartment model used to assess doses from releases of radioactive materials to the atmosphere from nuclear testingCompartment model used to assess doses from releases of radioactive materials to the atmosphere from nuclear testing |
|
Changes with time in activity concentration of 90Sr in Russian and Finnish riversChanges with time in activity concentration of 90Sr in Russian and Finnish rivers |
|
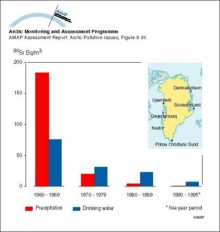
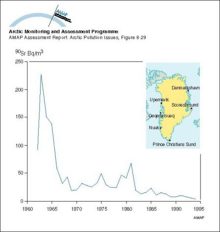
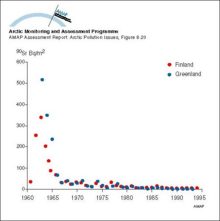
Ten-year averages of 90Sr activity concentrations in drinking water and precipitation in GreenlandTen-year averages of 90Sr activity concentrations in drinking water and precipitation in Greenland |
|
Changes with time in average activity concentration of 90Sr in drinking water in GreenlandChanges with time in average activity concentration of 90Sr in drinking water in Greenland |
|
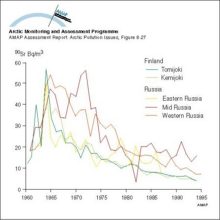
Changes with time in 131I activity concentration in Finnish air samplesChanges with time in 131I activity concentration in Finnish air samples |
|
Changes with time in wet and dry deposition of 90Sr in Arctic Finland and GreenlandChanges with time in wet and dry deposition of 90Sr in Arctic Finland and Greenland |
|

water OR waste searches for either of these words
oceans AND biodiversity searches for blocks with both words
pollution NEAR water searches for blocks with either of these words, with them being closer ranks higher
"climate change" searches for this phrase