|
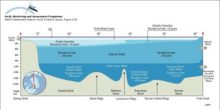
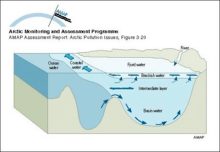
A schematic representation of the three-layer structure of the Arctic Ocean, with the Arctic Surface Layer above the Atlantic Water and Arctic Deep Water The residence time for the different water [..]
|
|
|
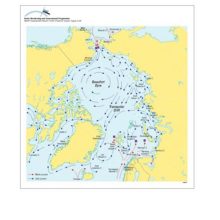
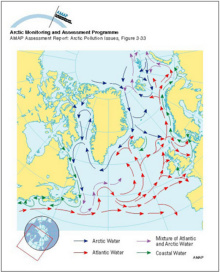
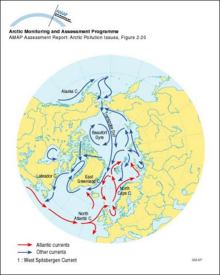
Surface currents in the Arctic region Square boxes indicate that the denser inflowing (Atlantic and Pacific) waters are submerging under the Polar Surface Water The continuation of these flows can be [..]
|
|
|
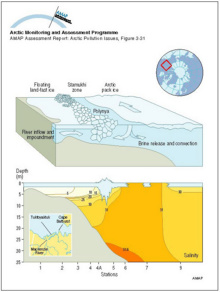
A schematic diagram showing the inflow from the Mackenzie River trapped in the nearshore zone beneath the landfast ice Beyond the stamukhi zone, intermittent opening and refreezing in the flaw lead [..]
|
|
|
Distribution of potential temperature, salinity, and density across the Arctic Ocean and the Greenland and Norwegian Seas
|

|
|
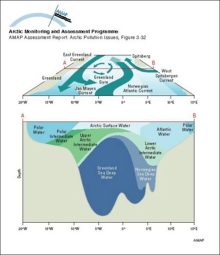
Schematic diagrams of the Greenland Sea showing the surface circulation (above) and water mass structure at a section across the central gyre (below)
|
|
|
Major surface currents in the North Atlantic Ocean
|
|
|
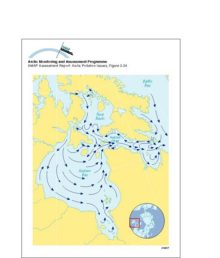
Surface currents in Hudson Bay, Hudson Strait and Foxe Basin
|
|
|
Transport of 90Sr, originating from Sellafield, along the coast of Norway The highest values are found in the Norwegian Coastal Current and decrease northward
|

|
|
Temperature and salinity of the Labrador Sea The cold freshwater from the Arctic Ocean and Baffin Bay is seen above the continental shelf
|

|
|
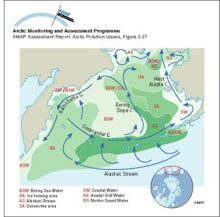
Schematic diagram of circulation and the extent of different water masses in the Bering Sea
|
|
|
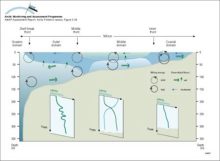
The different domains of the Bering Sea continental shelf are separated by fronts The coastal domain (depth <50m) tends to be vertically homogeneous, the middle domain (50-100m) shows a clear [..]
|
|
|
Conceptual model of the coastal zone and marine environments showing the main subcompartments and contaminant transfers, and exchanges with the atmosphere
|

|
|
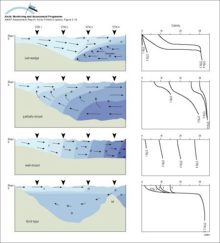
Basic circulation and salinity distribution in salt wedge, partially-mixed, well-mixed and fjord-type estuaries as defined by Wollast and Duinker (1982) Numbers and shading show salinity values
|
|
|
Sketch of main circulation pattern in a fjord
|
|
|
Surface ocean currents in the Arctic
|
|

water OR waste searches for either of these words
oceans AND biodiversity searches for blocks with both words
pollution NEAR water searches for blocks with either of these words, with them being closer ranks higher
"climate change" searches for this phrase