|
Emission rates of sulfur dioxide from Nikel together with annual average SO2 air concentrations measured at two sites in Norway (1978-1992)
|

|
|
Historical records of a) NO3- and b) SO42- concentrations from the Greenland icecap at Dye 3 c) A comparison of trends in the average SO42- and SO42- plus NO3- concentrations at Dye 3 in Greenland [..]
|

|
|
Calculated concentrations of SO2 and SO42- compared with measurements at Station Nord in northeastern Greenland
|

|
|
The time series of light scattering (?sp) and optical depth (?) at 500 nm at Barrow, Alaska
|

|
|
SMART model results for selected soil and lake output variables at Christmas lakes for the past 90 years and for three future scenarios assuming a 0%, 70% and 95% reduction of the present sulfur [..]
|

|
|
Monthly snow cover anomalies over northern hemispheric lands (including Greenland) between January 1972 and August 1995 Also shown are the 12-month running anomalies of hemispheric snow extent, [..]
|

|
|
Snow cover over northern hemisphere lands between 1972 and 1996 for different seasons Values are determined from analyses of NOAA snow charts created using visible satellite imagery
|

|
|
History of temperature changes in central Greenland over the last 40 000 years, from the GISP2 core, showing very large and probably abrupt changes
|

|
|
History of snow accumulation in central Greenland during the most recent glaciation, as measured in the GISP2 core The 25-year running mean, represented in all panels, shows very large and rapid [..]
|

|
|
Trends in (annual average) ozone mixing ratio over Canada from 1980 to 1993
|

|
|
Body burdens of radiocaesium (yearly averages) across the Canadian Arctic
|

|
|
Schematic representation of shelf processes involving transport of contaminants and sea ice
|

|
|
Average annual maximum and minimum sea ice extent The numbered lines show the expected time in years for the ice at that location to exit the Arctic Ocean through the Fram Strait, based on drifting [..]
|

|
|
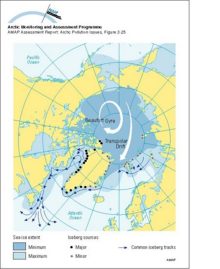
Main sources of icebergs and common iceberg drift trajectories The main ice circulation pattern follows the Transpolar Drift in the eastern Arctic and the Beaufort Gyre in the western Arctic (white [..]
|
|
|
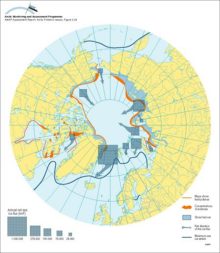
Approximate net sea ice exchange (see legend for key to arrow sizes), extent of shorefast ice and winter sea ice, and coastal polynyas and main polynya concentrations
|
|

water OR waste searches for either of these words
oceans AND biodiversity searches for blocks with both words
pollution NEAR water searches for blocks with either of these words, with them being closer ranks higher
"climate change" searches for this phrase