|
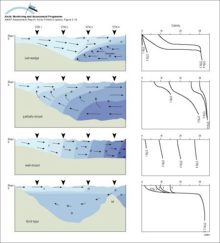
Basic circulation and salinity distribution in salt wedge, partially-mixed, well-mixed and fjord-type estuaries as defined by Wollast and Duinker (1982) Numbers and shading show salinity values
|
|
|
Distribution of potential temperature, salinity, and density across the Arctic Ocean and the Greenland and Norwegian Seas
|

|
|
Winter and summer surface water salinity in the Arctic Ocean and adjacent seas
|

|
|
Temperature and salinity of the Labrador Sea The cold freshwater from the Arctic Ocean and Baffin Bay is seen above the continental shelf
|

|
|
Schematic representation of the temperature and salinity structure of the upper Arctic Ocean and how the halocline layer is maintained by brine-rich water produced on the shelves
|

|
|
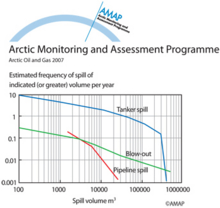
Relationship between frequency and volume of releases to the marine environment from different sources (worldwide)
|
|
|
History of temperature changes in central Greenland over the last 40 000 years, from the GISP2 core, showing very large and probably abrupt changes
|

|
|
Lower stratospheric temperature record since 1979
|

|
|
Lower stratospheric (ca 120-40 hPa) Arctic temperature trends (°C per decade, January 1979 to February 1996), as monitored by MSUs on polar orbiting satellites
|

|
|
Lower tropospheric Arctic temperature trends (°C per decade, January 1979 to February 1996), as monitored by MSUs on polar orbiting satellites
|

|
|
Seasonal and annual average surface temperature trends (°C per decade) over the northern hemisphere
|

|
|
Distribution of radioactivity (PCi/L) in the surface layer of the ocean after ten years of simulation of Preller's model Source locations are the Ob, Yenisey and Pechora Rivers, as well as Sellafield
|

|
|
Yearly and depth-averaged concentrations (Bq/m3) of 137Cs after 6 years from Harms' model The sources are instantaneous releases of 1 PBq from the dump sites in Abrosimov Bay, Stepovogo Bay, Tsivolky [..]
|
|
|
Vertically integrated tracer burden shown after 15 years Units are burden per unit surface area, normalized by cumulative release Bottom topography is in meters; a) no neptune, centered difference, [..]
|
|
|
Locations of sea dumping of radioactive waste in the Russian Arctic
|

|

water OR waste searches for either of these words
oceans AND biodiversity searches for blocks with both words
pollution NEAR water searches for blocks with either of these words, with them being closer ranks higher
"climate change" searches for this phrase