Your query returned 18 graphics.
Results 1 - 15
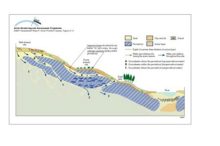
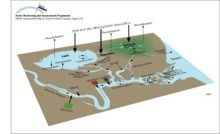
Groundwater in permafrostOccurrence of groundwater in permafrost areas |
|
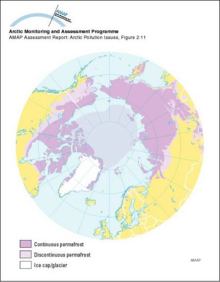
Circumpolar permafrost distributionCircumpolar permafrost distribution |
|
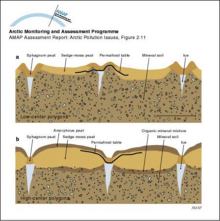
Polygon developmentLow-center and high-center polygon development |
|
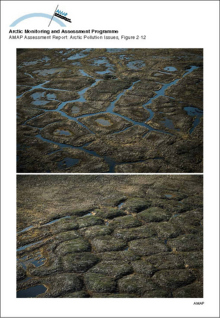
Low and high-center polygonsLow and high-center polygons |
|
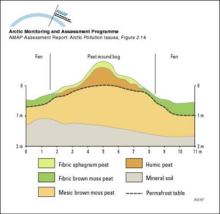
Peat mound bogCross-section of a peat mound bog |
|
Conceptual model of the terrestrial/freshwater compartment showing the main subcompartments and contaminant transfers, and exchanges with the atmosphere and oceansConceptual model of the terrestrial/freshwater compartment showing the main subcompartments and contaminant transfers, and exchanges with the atmosphere and oceans |
|
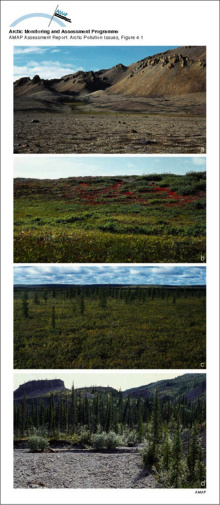
Biogeographical zones within the AMAP assessment area, a) High Arctic, b) Low Arctic, c) subarctic, and d) boreal forestBiogeographical zones within the AMAP assessment area, a) High Arctic, b) Low Arctic, c) subarctic, and d) boreal forest |
|
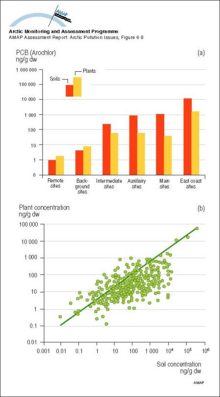
Concentrations of Aroclor PCBs in soils and plants (ng/g dw) associated with military radar sites in the Canadian Arctic a) Mean and maximum total PCB concentrations in soils and associated plants from remote (>20 km), backgroundConcentrations of Aroclor PCBs in soils and plants (ng/g dw) associated with military radar sites in the Canadian Arctic a) Mean and maximum total PCB concentrations in soils and associated plants [..] |
|
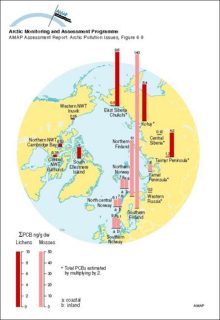
Average concentration (ng/g dw) of PCBs in Arctic lichen and mossesAverage concentration (ng/g dw) of PCBs in Arctic lichen and mosses |
|
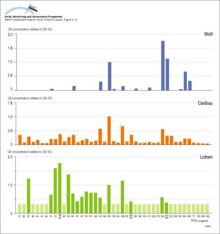
Relative tissue concentrations of organochlorine compounds detected in lichen, and in adipose tissue of caribou and wolf at three locations in the Northwest Territories, CanadaRelative tissue concentrations of organochlorine compounds detected in lichen, and in adipose tissue of caribou and wolf at three locations in the Northwest Territories, Canada |

|
Observed and predicted organochlorine concentrations (ng/g ww) in caribou and reindeer (Rangifer tarandus) liver All data are presented in, or were derived from data in Annex Table 6A4Observed and predicted organochlorine concentrations (ng/g ww) in caribou and reindeer (Rangifer tarandus) liver All data are presented in, or were derived from data in Annex Table 6A4 |
|
Concentrations of PCB congeners relative to PCB congener 153 for lichen, caribou, and wolf in the Bathurst herd, Canada The light bars denote that the congener was not detectedConcentrations of PCB congeners relative to PCB congener 153 for lichen, caribou, and wolf in the Bathurst herd, Canada The light bars denote that the congener was not detected |
|
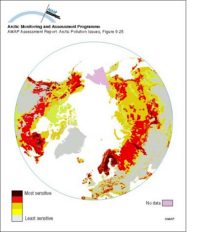
Sensitivity of Arctic ecosystems to acid depositionSensitivity of Arctic ecosystems to acid deposition |
|
(a) Critical deposition of sulfur, and (b) its exceedance, in forest soils of northern Europe and Russia (5th percentile of the calculation points in each EMEP grid cell)(a) Critical deposition of sulfur, and (b) its exceedance, in forest soils of northern Europe and Russia (5th percentile of the calculation points in each EMEP grid cell) |

|
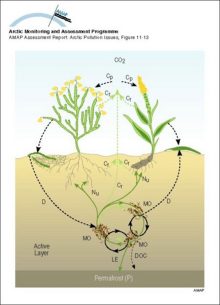
Schematic illustration of ecosystem carbon fluxes and nutrient circulation in the tundra Carbon and nutrient pathways are shown by dashed and continuous lines, respectivelySchematic illustration of ecosystem carbon fluxes and nutrient circulation in the tundra Carbon and nutrient pathways are shown by dashed and continuous lines, respectively |
|

water OR waste searches for either of these words
oceans AND biodiversity searches for blocks with both words
pollution NEAR water searches for blocks with either of these words, with them being closer ranks higher
"climate change" searches for this phrase