|
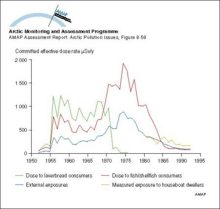
Comparison of doses to critical groups for Sellafield discharges from 1952 to 1993
|
|
|
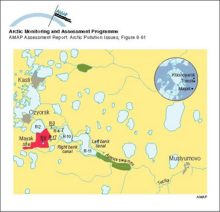
The system of dams and drainage channels at Mayak
|
|
|
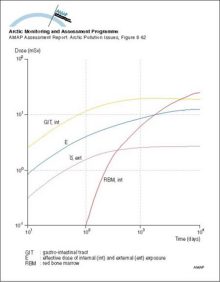
Dose accumulation in adult rural residents after the Kyshtym accident in 1957
|
|
|
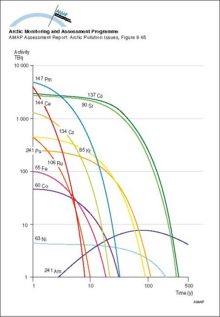
The changing inventory of major radionuclides in the Komsomolets reactor with time
|
|
|
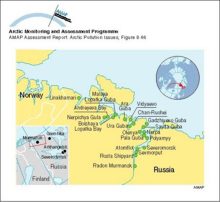
Major Russian naval bases along the Kola Peninsula and White Sea
|
|
|
Predicted release rates of different radionuclide groups from the submarine reactor dumped in the Novaya Zemlya Trough (best estimate scenario)
|

|
|
Locations of sea dumping of radioactive waste in the Russian Arctic
|

|
|
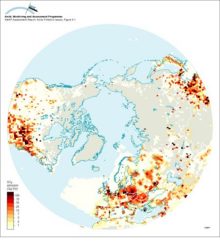
Anthropogenic SO2 emissions for 1985 north of 30°N
|
|
|
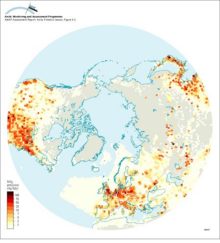
Anthropogenic NOx emissions for 1985 north of 30°N
|
|
|
SO2 emissions north of 50°N (modified after Benkovitz et al 1995, see Figure 91) showing point source emissions from Arctic and subarctic non-ferrous smelters and including natural DMS sources from [..]
|
|
|
Time series of emissions of SO2 from European sources (Mylona 1993) and two major sources on the Kola Peninsula
|

|
|
Vertical distribution of Arctic haze in summer, winter, and the whole year Sulfur air concentrations and relative source-contribution (%) for different heights above the ground are shown The [..]
|

|
|
Emission rates of sulfur dioxide from Nikel together with annual average SO2 air concentrations measured at two sites in Norway (1978-1992)
|

|
|
(a) Vertical distribution of SOx (SO2 + SO42-) concentrations averaged over the area north of 75°N, and (b) contributions from the different sources
|

|
|
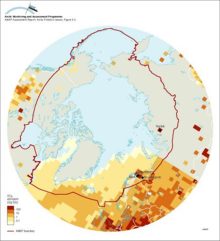
Model calculations of sulfur deposition and fraction of dry deposition for the period July 1990 to June 1991 in northern Fennoscandia and the Kola Peninsula
|

|

water OR waste searches for either of these words
oceans AND biodiversity searches for blocks with both words
pollution NEAR water searches for blocks with either of these words, with them being closer ranks higher
"climate change" searches for this phrase