Your query returned 143 graphics.
Results 61 - 75
The time series of light scattering (?sp) and optical depth (?) at 500 nm at Barrow, AlaskaThe time series of light scattering (?sp) and optical depth (?) at 500 nm at Barrow, Alaska |

|
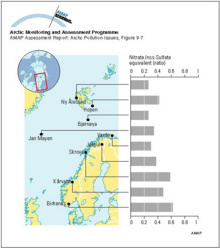
Variation of the nitrate to non-seasalt (nss) sulfate equivalent ratio in precipitation at Norwegian recording stations based on measurements between August 1982 and July 1984Variation of the nitrate to non-seasalt (nss) sulfate equivalent ratio in precipitation at Norwegian recording stations based on measurements between August 1982 and July 1984 |
|
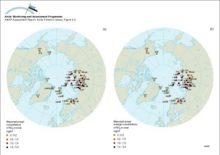
Concentrations of (a) sulfate and (b) nitrate in snowConcentrations of (a) sulfate and (b) nitrate in snow |
|
Historical records of a) NO3- and b) SO42- concentrations from the Greenland icecap at Dye 3 c) A comparison of trends in the average SO42- and SO42- plus NO3- concentrations at Dye 3 in Greenland and in the annual mean H+ concentration from Agassiz iceHistorical records of a) NO3- and b) SO42- concentrations from the Greenland icecap at Dye 3 c) A comparison of trends in the average SO42- and SO42- plus NO3- concentrations at Dye 3 in Greenland [..] |

|
Scatterplots for comparisons between the average concentrations of SO2 and SO4 in air from October 1990 to December 1993 as monitored by the European Monitoring and Evaluation Programme (EMEP) and calculated by Christensen (1996)Scatterplots for comparisons between the average concentrations of SO2 and SO4 in air from October 1990 to December 1993 as monitored by the European Monitoring and Evaluation Programme (EMEP) and [..] |

|
Calculated concentrations of SO2 and SO42- compared with measurements at Station Nord in northeastern GreenlandCalculated concentrations of SO2 and SO42- compared with measurements at Station Nord in northeastern Greenland |

|
The predicted (1988) average surface air sulfate concentrations in the ArcticThe predicted (1988) average surface air sulfate concentrations in the Arctic |

|
The predicted (1988) average surface air sulfur dioxide concentrations in the ArcticThe predicted (1988) average surface air sulfur dioxide concentrations in the Arctic |

|
Transect south–north across the survey area near the western boundary in 1995Transect south–north across the survey area near the western boundary in 1995, showing: (a) pH in a water extract of the O-horizon; (b) ammonium acetate extractable (pH 4.5) base cation concentrations [..] |

|
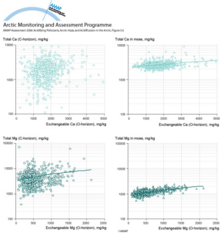
Ammonium acetate extractable Ca and Mg in the O-horizon of soilsAmmonium acetate extractable Ca and Mg in the O-horizon of soils (x-axis) vs. their total concentrations (aqua regia extractable) in the C-horizon of soils and in moss in 1995 |
|
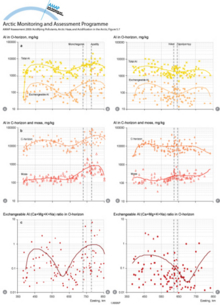
A comparison of the two west–east transects across the survey area in 1995A comparison of the two west–east transects across the survey area in 1995, showing changes from east to west in (a) total Al (nitric acid) and exchangeable Al concentrations in the O-horizon; (b) [..] |
|
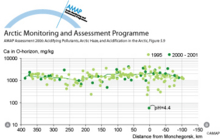
Transect west–east across the survey area showing exchangeable Ca in the O-horizon of podzol soils in 1995 and from 2000 to 2001Transect west–east across the survey area showing exchangeable Ca in the O-horizon of podzol soils in 1995 (Kola Ecogeochemistry Project) and from 2000 to 2001 (Barents Ecogeochemistry Project) |
|
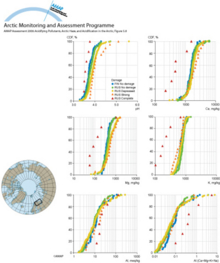
Cumulative distribution functions (CDF, %) of pH (water extraction)Cumulative distribution functions (CDF, %) of pH (water extraction), exchangeable Ca, Mg, K, and Al concentrations and the exchangeable Al:(Ca+Mg+K+Na) ratio in the O-horizon in the ‘no visual damage’ [..] |
|
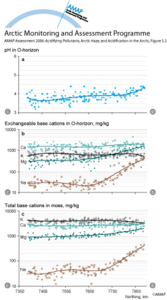
Transect south–north across the survey area near the western boundary in 1995Transect south–north across the survey area near the western boundary in 1995 (C–D on Figure 5.2), showing: (a) pH in a water extract of the O-horizon; (b) ammonium acetate extractable (pH 4.5) base [..] |
|
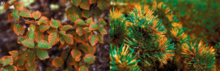
Visible (acute) SO2 injuries on (a) birch leaves and (b) Scots pine needles at SvanvikVisible (acute) SO2 injuries on (a) birch (Betula pubescens) leaves and (b) Scots pine (Pinus sylvestris) needles at Svanvik, Norway, approximately 10 km northwest of Nikel |
|

water OR waste searches for either of these words
oceans AND biodiversity searches for blocks with both words
pollution NEAR water searches for blocks with either of these words, with them being closer ranks higher
"climate change" searches for this phrase