Your query returned 98 graphics.
Results 76 - 90
(a) The contribution from the different sources to the total deposition, averaged over the area north of 75°N from October 1990 to May 1994, (b) the calculated total monthly depositions of SOx averaged over the area north of 75°N, and (c) the(a) The contribution from the different sources to the total deposition, averaged over the area north of 75°N from October 1990 to May 1994, (b) the calculated total monthly depositions of SOx [..] |

|
Model calculations of total (wet and dry) deposition estimates of sulfur for 1988Model calculations of total (wet and dry) deposition estimates of sulfur for 1988 |

|
Vertical distribution of Arctic haze in summer, winter, and the whole year Sulfur air concentrations and relative source-contribution (%) for different heights above the ground are shown The concentrations are averages over the Arctic area north of 70°NVertical distribution of Arctic haze in summer, winter, and the whole year Sulfur air concentrations and relative source-contribution (%) for different heights above the ground are shown The [..] |

|
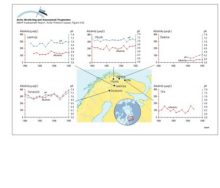
Annual average of alkalinity and pH as measured in rivers in northern Fennoscandia and the Kola PeninsulaAnnual average of alkalinity and pH as measured in rivers in northern Fennoscandia and the Kola Peninsula |
|
Annual average of sulfate and base cation concentrations as measured in rivers in northern Fennoscandia and the Kola Peninsula Note: SO4 (non-seasalt) estimated for river Utsjoki from total sulfurAnnual average of sulfate and base cation concentrations as measured in rivers in northern Fennoscandia and the Kola Peninsula Note: SO4 (non-seasalt) estimated for river Utsjoki from total sulfur |
|
Contaminant emissions, transport and deposition in the ArcticAn illustration of the interplay between a) contaminant emissions distribution for sulfur dioxide and b) frequency of atmospheric south-to-north transport, yielding c) a net annual input of sulfur to [..] |

|
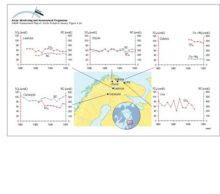
Average (15-month) and 24-h average maximum air concentrations of Ni, Cu and As measured at several stations in northern Norway near to major point sources on the Kola PeninsulaAverage (15-month) and 24-h average maximum air concentrations of Ni, Cu and As measured at several stations in northern Norway near to major point sources on the Kola Peninsula |
|
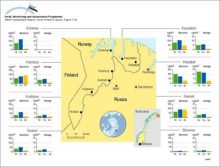
Median concentrations of sulfate, base cations, and nitrate in lakes of northern Fennoscandia and the Kola PeninsulaMedian concentrations of sulfate, base cations, and nitrate in lakes of northern Fennoscandia and the Kola Peninsula |
|
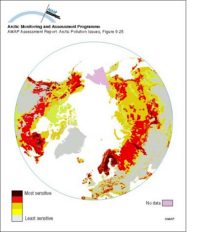
Sensitivity of Arctic ecosystems to acid depositionSensitivity of Arctic ecosystems to acid deposition |
|
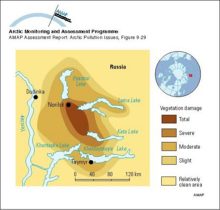
Vegetation damage zones around NorilskVegetation damage zones around Norilsk |
|
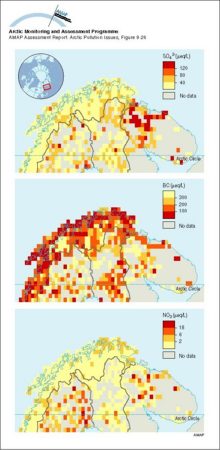
(a) Critical deposition of sulfur, and (b) its exceedance, in forest soils of northern Europe and Russia (5th percentile of the calculation points in each EMEP grid cell)(a) Critical deposition of sulfur, and (b) its exceedance, in forest soils of northern Europe and Russia (5th percentile of the calculation points in each EMEP grid cell) |

|
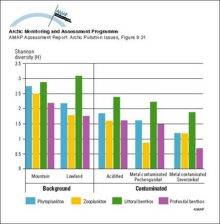
Diversity indices (Shannon-Weaver means) for phytoplankton, zooplankton and zoobenthos in lakes and streams in the Murmansk regionDiversity indices (Shannon-Weaver means) for phytoplankton, zooplankton and zoobenthos in lakes and streams in the Murmansk region |
|
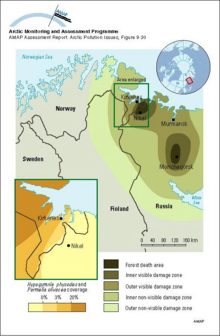
Approximate forest damage zones in the vicinity of Monchegorsk and Nikel and the visible-damage and non-visible-damage zones on the Kola Peninsula and Finnish Lapland The inset shows coverage (%) of lichens (Hypogymnia physodes and Parmelia olivacea) onApproximate forest damage zones in the vicinity of Monchegorsk and Nikel and the visible-damage and non-visible-damage zones on the Kola Peninsula and Finnish Lapland The inset shows coverage (%) of [..] |
|
SMART model results for selected soil and lake output variables at Christmas lakes for the past 90 years and for three future scenarios assuming a 0%, 70% and 95% reduction of the present sulfur deposition levelsSMART model results for selected soil and lake output variables at Christmas lakes for the past 90 years and for three future scenarios assuming a 0%, 70% and 95% reduction of the present sulfur [..] |

|
MAGIC model results for the streamwater at Dalelva for the past 90 years and for three future scenarios assuming a 0%, 70%, and 95% reduction of the present sulfur deposition levelsMAGIC model results for the streamwater at Dalelva for the past 90 years and for three future scenarios assuming a 0%, 70%, and 95% reduction of the present sulfur deposition levels |

|

water OR waste searches for either of these words
oceans AND biodiversity searches for blocks with both words
pollution NEAR water searches for blocks with either of these words, with them being closer ranks higher
"climate change" searches for this phrase