Your query returned 73 graphics.
Results 31 - 45
Water/air fugacity ratios (fw/fa) of alpha-HCH and gamma-HCH on a transect from the Bering Sea to the Greenland Sea in July and August 1994 A fugacity ratio of 1 indicates air-water equilibriumWater/air fugacity ratios (fw/fa) of alpha-HCH and gamma-HCH on a transect from the Bering Sea to the Greenland Sea in July and August 1994 A fugacity ratio of 1 indicates air-water equilibrium |

|
Migration patterns of four main stocks of eider ducks from the Canadian Arctic Organochlorines in the same four stocksMigration patterns of four main stocks of eider ducks from the Canadian Arctic Organochlorines in the same four stocks |
|
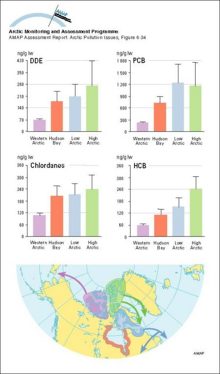
Correlations between concentrations (lw) of major persistent OCs and trophic level in the marine food web for Svalbard and Lancaster Sound Trophic level data were assigned based on Hobson and Welch (1992)Correlations between concentrations (lw) of major persistent OCs and trophic level in the marine food web for Svalbard and Lancaster Sound Trophic level data were assigned based on Hobson and Welch [..] |

|
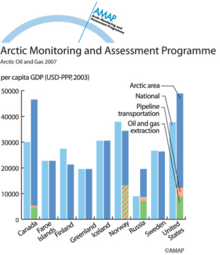
GDP in Arctic regions compared with national averagesGDP in Arctic regions compared with national averages (2002), showing the contribution of oil and gas extraction and pipeline transport to the regional GDP |
|
(a) Trajectories of five satellite-tracked buoys launched in Mackenzie Bay, Canada, and (b) results of 30-day trajectories of oil launched from five hypothetical spill locations in the Beaufort Sea(a) Trajectories of five satellite-tracked buoys launched in Mackenzie Bay, Canada, and (b) results of 30-day trajectories of oil launched from five hypothetical spill locations in the Beaufort Sea |

|
Sequence of oil-ice interaction including drops under the ice, new ice growth below the oil, oil appearing on the surface in the spring, wind herding of oil on melt pools, and the appearance of emulsified oil on top of the iceSequence of oil-ice interaction including drops under the ice, new ice growth below the oil, oil appearing on the surface in the spring, wind herding of oil on melt pools, and the appearance of [..] |
|
Model evaluation comparing a five-day model simulation with results of an oil release experiment in the marginal ice zone near Svalbard in April 1993Model evaluation comparing a five-day model simulation with results of an oil release experiment in the marginal ice zone near Svalbard in April 1993 |

|
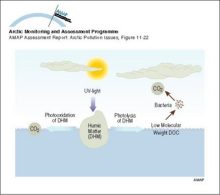
Illustration of the role of UV radiation in the biogeochemical cycling of DOCIllustration of the role of UV radiation in the biogeochemical cycling of DOC |
|
Illustration of the role of UV radiation in various light-dependent processes Natural UV radiation impacts the numbers, distribution and activity of several aquatic ecosystem targets and thus, theoretically, their interactionsIllustration of the role of UV radiation in various light-dependent processes Natural UV radiation impacts the numbers, distribution and activity of several aquatic ecosystem targets and thus, [..] |

|
Changes with time in 137Cs contamination in the food chain lichen - reindeer - humansChanges with time in 137Cs contamination in the food chain lichen - reindeer - humans |

|
Temporal variation in calculated reindeer Tag values for different Arctic regionsTemporal variation in calculated reindeer Tag values for different Arctic regions |

|
Spatial trends in the net flux from reindeer meat in different Arctic areas, for the first year after an assumed uniform deposition of 100 kBq/m2Spatial trends in the net flux from reindeer meat in different Arctic areas, for the first year after an assumed uniform deposition of 100 kBq/m2 |

|
Temporal variation in cow milk Tag values for Sweden, Norway and FinlandTemporal variation in cow milk Tag values for Sweden, Norway and Finland |

|
Comparison of the predicted flux of 137Cs in milk and reindeer meat in different Arctic areas, for the first year after an assumed uniform deposition of 100 kBq/m2Comparison of the predicted flux of 137Cs in milk and reindeer meat in different Arctic areas, for the first year after an assumed uniform deposition of 100 kBq/m2 |

|
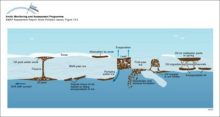
Major pathways of contaminants into and within the Arctic environmentA multi-compartment schematic diagram of the major pathways of contaminants into and within the Arctic environment |

|

water OR waste searches for either of these words
oceans AND biodiversity searches for blocks with both words
pollution NEAR water searches for blocks with either of these words, with them being closer ranks higher
"climate change" searches for this phrase