Your query returned 73 graphics.
Results 46 - 60
Contaminant emissions, transport and deposition in the ArcticAn illustration of the interplay between a) contaminant emissions distribution for sulfur dioxide and b) frequency of atmospheric south-to-north transport, yielding c) a net annual input of sulfur to [..] |

|
Seawater concentrations of 137Cs in the Barents and East Greenland Seas compared to the yearly releases from SellafieldSeawater concentrations of 137Cs in the Barents and East Greenland Seas compared to the yearly releases from Sellafield |

|
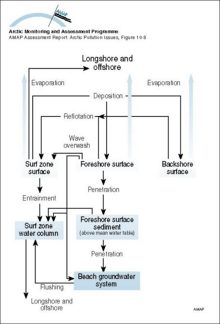
Mass transport pathways considered in the Coastal Zone Oil Spill Model (COZOIL), developed to simulate dynamic transport and weathering of oil on US Arctic coastsMass transport pathways considered in the Coastal Zone Oil Spill Model (COZOIL), developed to simulate dynamic transport and weathering of oil on US Arctic coasts |
|
(a) Vertical distribution of SOx (SO2 + SO42-) concentrations averaged over the area north of 75°N, and (b) contributions from the different sources(a) Vertical distribution of SOx (SO2 + SO42-) concentrations averaged over the area north of 75°N, and (b) contributions from the different sources |

|
Summer and winter visibility observations (for relative humidities less than 80%) for the period 1951 to 1993 in North AmericaSummer and winter visibility observations (for relative humidities less than 80%) for the period 1951 to 1993 in North America |

|
Tracer concentration on a vertical section (along Y=0 on Figure 346) after 15 years; a) no neptune, centered difference; b) neptune, flux-corrected transport; c,d) velocity normal to the section with positive "into" the page, negative "out" of the page;Tracer concentration on a vertical section (along Y=0 on Figure 346) after 15 years; a) no neptune, centered difference; b) neptune, flux-corrected transport; c,d) velocity normal to the section with [..] |

|
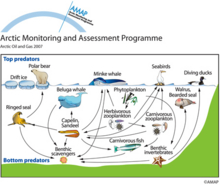
Simplified Barents Sea food-webThe Barents Sea is moderately productive, but being large, it supports large fish populations. Walrus, bowheads and other large whales were seriously depleted by this previous hunting, and have been [..] |
|
A schematic of the three-level thermodynamic snow ice system modelA schematic of the three-level thermodynamic snow ice system model |
|
Model calculations of total (wet and dry) deposition estimates of sulfur for 1988Model calculations of total (wet and dry) deposition estimates of sulfur for 1988 |

|
Vertical distribution of Arctic haze in summer, winter, and the whole year Sulfur air concentrations and relative source-contribution (%) for different heights above the ground are shown The concentrations are averages over the Arctic area north of 70°NVertical distribution of Arctic haze in summer, winter, and the whole year Sulfur air concentrations and relative source-contribution (%) for different heights above the ground are shown The [..] |

|
SMART model results for selected soil and lake output variables at Christmas lakes for the past 90 years and for three future scenarios assuming a 0%, 70% and 95% reduction of the present sulfur deposition levelsSMART model results for selected soil and lake output variables at Christmas lakes for the past 90 years and for three future scenarios assuming a 0%, 70% and 95% reduction of the present sulfur [..] |

|
MAGIC model results for the streamwater at Dalelva for the past 90 years and for three future scenarios assuming a 0%, 70%, and 95% reduction of the present sulfur deposition levelsMAGIC model results for the streamwater at Dalelva for the past 90 years and for three future scenarios assuming a 0%, 70%, and 95% reduction of the present sulfur deposition levels |

|
Averaged upper (3000 m) air concentrations of Pb in winter (December-February) and summer (June-August) as modeled by the updated (1996) hemispheric EMEP transport model in a simulation for the reference year 1988Averaged upper (3000 m) air concentrations of Pb in winter (December-February) and summer (June-August) as modeled by the updated (1996) hemispheric EMEP transport model in a simulation for the [..] |

|
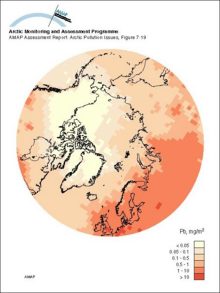
Lead deposition as modeled by the updated (1996) hemispheric EMEP transport model in a simulation for the reference year 1988Lead deposition as modeled by the updated (1996) hemispheric EMEP transport model in a simulation for the reference year 1988 |
|
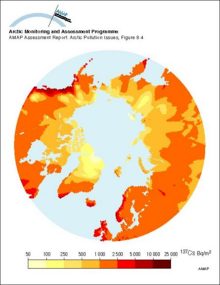
Estimated ground deposition of nuclear weapons fallout of 137Cs based on precipitation data, decay corrected to 1995Estimated ground deposition of nuclear weapons fallout of 137Cs based on precipitation data, decay corrected to 1995 |
|

water OR waste searches for either of these words
oceans AND biodiversity searches for blocks with both words
pollution NEAR water searches for blocks with either of these words, with them being closer ranks higher
"climate change" searches for this phrase