|
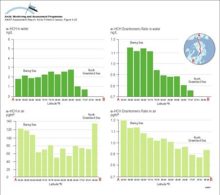
Trends in alpha-HCH and enantiomer ratios (ER) on a transect from the Bering Sea across the polar cap to the Greenland Sea during the Arctic Ocean Transect Study of July and August 1994
|
|
|
Water/air fugacity ratios (fw/fa) of alpha-HCH and gamma-HCH on a transect from the Bering Sea to the Greenland Sea in July and August 1994 A fugacity ratio of 1 indicates air-water equilibrium
|

|
|
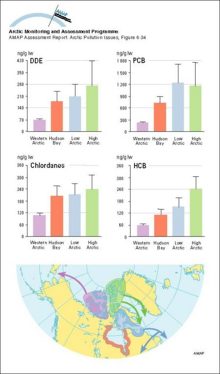
Migration patterns of four main stocks of eider ducks from the Canadian Arctic Organochlorines in the same four stocks
|
|
|
Correlations between concentrations (lw) of major persistent OCs and trophic level in the marine food web for Svalbard and Lancaster Sound Trophic level data were assigned based on Hobson and Welch [..]
|

|
|
Tracer concentration on a vertical section (along Y=0 on Figure 346) after 15 years; a) no neptune, centered difference; b) neptune, flux-corrected transport; c,d) velocity normal to the section with [..]
|

|
|
Averaged upper (3000 m) air concentrations of Pb in winter (December-February) and summer (June-August) as modeled by the updated (1996) hemispheric EMEP transport model in a simulation for the [..]
|

|
|
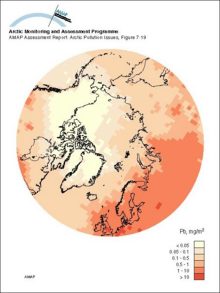
Lead deposition as modeled by the updated (1996) hemispheric EMEP transport model in a simulation for the reference year 1988
|
|
|
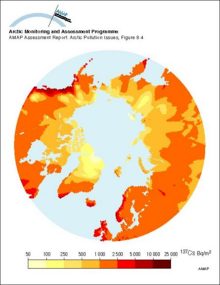
Estimated ground deposition of nuclear weapons fallout of 137Cs based on precipitation data, decay corrected to 1995
|
|
|
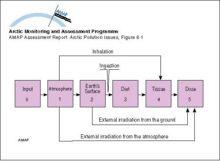
Compartment model used to assess doses from releases of radioactive materials to the atmosphere from nuclear testing
|
|
|
Model calculations of sulfur deposition and fraction of dry deposition for the period July 1990 to June 1991 in northern Fennoscandia and the Kola Peninsula
|

|
|
Model calculations of ground level yearly average sulfur dioxide air concentration on the Kola Peninsula
|

|
|
An example of a positive feedback loop Warming leads to a decrease in sea ice cover which in turn leads to a decrease in albedo over the ocean, the result of which is further warming and further [..]
|

|
|
The hydrologic balance in the Arctic is highly dynamic on the seasonal time scale with large and rapid ice melts in the spring On land, this ice and snow melting results in large rapid floods and [..]
|

|
|
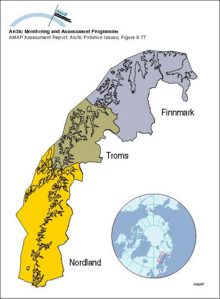
Norwegian counties considered in the flux vulnerability case study
|
|
|
Relative 137Cs output in foodstuffs from the different Arctic Norwegian counties in the first year after an assumed uniform deposition of 100 kBq/m2
|

|

water OR waste searches for either of these words
oceans AND biodiversity searches for blocks with both words
pollution NEAR water searches for blocks with either of these words, with them being closer ranks higher
"climate change" searches for this phrase