|
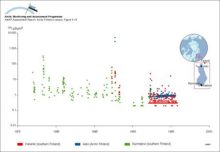
Changes with time in 131I activity concentration in Finnish air samples
|
|
|
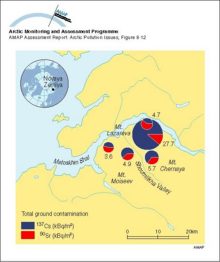
Local radionuclide contamination on Novaya Zemlya
|
|
|
Averaged upper (3000 m) air concentrations of Pb in winter (December-February) and summer (June-August) as modeled by the updated (1996) hemispheric EMEP transport model in a simulation for the [..]
|

|
|
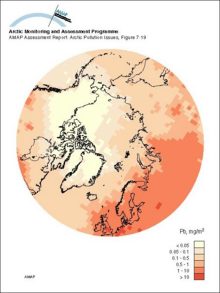
Lead deposition as modeled by the updated (1996) hemispheric EMEP transport model in a simulation for the reference year 1988
|
|
|
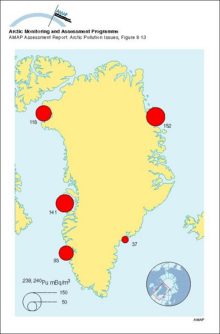
Concentrations of 239,240Pu in seawater around Greenland, 1968
|
|
|
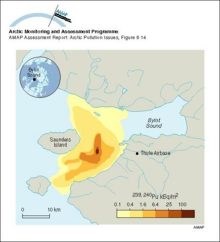
Activity concentrations of 239,240Pu in sediments near Thule, Greenland
|
|
|
Some of the dumped containers in Stepovogo Bay
|
|
|
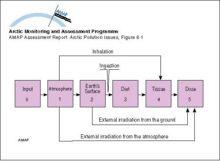
Compartment model used to assess doses from releases of radioactive materials to the atmosphere from nuclear testing
|
|
|
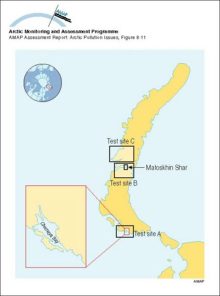
Nuclear weapons test sites on Novaya Zemlya
|
|
|
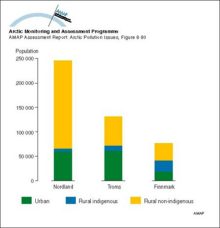
Distribution of the population of the three Arctic Norwegian counties
|
|
|
Scatterplots for comparisons between the average concentrations of SO2 and SO4 in air from October 1990 to December 1993 as monitored by the European Monitoring and Evaluation Programme (EMEP) and [..]
|

|
|
Calculated concentrations of SO2 and SO42- compared with measurements at Station Nord in northeastern Greenland
|

|
|
The predicted (1988) average surface air sulfate concentrations in the Arctic
|

|
|
The predicted (1988) average surface air sulfur dioxide concentrations in the Arctic
|

|
|
An example of a positive feedback loop Warming leads to a decrease in sea ice cover which in turn leads to a decrease in albedo over the ocean, the result of which is further warming and further [..]
|

|

water OR waste searches for either of these words
oceans AND biodiversity searches for blocks with both words
pollution NEAR water searches for blocks with either of these words, with them being closer ranks higher
"climate change" searches for this phrase