|
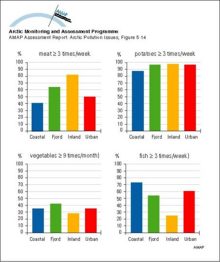
Frequency of consumption of food categories by Saami in Norway, percent of respondents, by society type
|
|
|
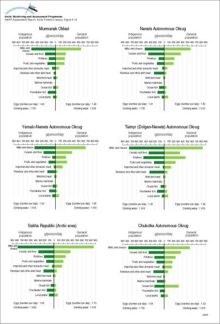
Average daily consumption of selected foods by indigenous and general populations in Arctic Russia, by region, g/person, in 1993
|
|
|
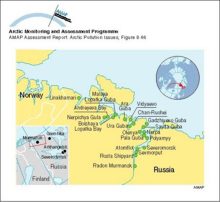
Locations of sea dumping of radioactive waste in the Russian Arctic
|

|
|
Scatterplots for comparisons between the average concentrations of SO2 and SO4 in air from October 1990 to December 1993 as monitored by the European Monitoring and Evaluation Programme (EMEP) and [..]
|

|
|
Model calculations of total (wet and dry) deposition estimates of sulfur for 1988
|

|
|
Vertical distribution of Arctic haze in summer, winter, and the whole year Sulfur air concentrations and relative source-contribution (%) for different heights above the ground are shown The [..]
|

|
|
Model calculations of sulfur deposition and fraction of dry deposition for the period July 1990 to June 1991 in northern Fennoscandia and the Kola Peninsula
|

|
|
Model calculations of ground level yearly average sulfur dioxide air concentration on the Kola Peninsula
|

|
|
The predicted (1988) average surface air sulfate concentrations in the Arctic
|

|
|
The predicted (1988) average surface air sulfur dioxide concentrations in the Arctic
|

|
|
MAGIC model results for the streamwater at Dalelva for the past 90 years and for three future scenarios assuming a 0%, 70%, and 95% reduction of the present sulfur deposition levels
|

|
|
A schematic of the three-level thermodynamic snow ice system model
|

|
|
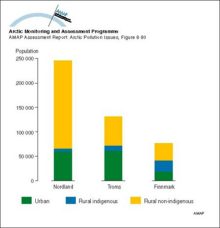
Distribution of the population of the three Arctic Norwegian counties
|
|
|
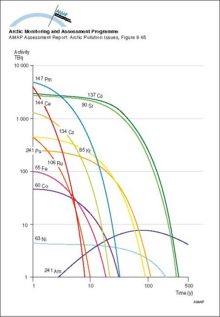
The changing inventory of major radionuclides in the Komsomolets reactor with time
|
|
|
Major Russian naval bases along the Kola Peninsula and White Sea
|
|

water OR waste searches for either of these words
oceans AND biodiversity searches for blocks with both words
pollution NEAR water searches for blocks with either of these words, with them being closer ranks higher
"climate change" searches for this phrase