|
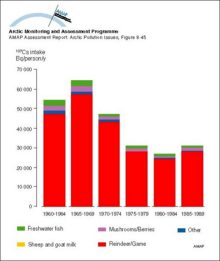
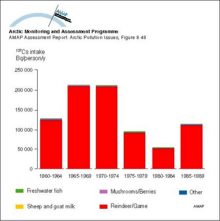
Yearly intake of 137Cs from various dietary components by the ‘selected’ population of Greenland
|
|
|
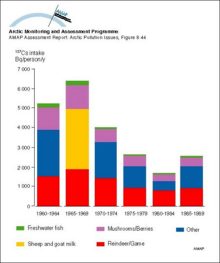
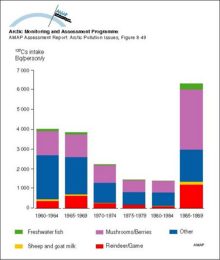
Yearly intake of 137Cs from various dietary components by the average population of Greenland
|
|
|
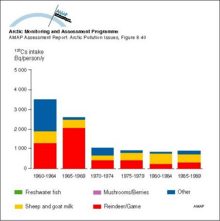
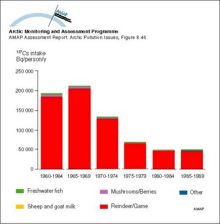
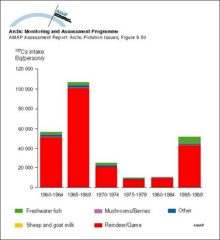
Yearly intake of 137Cs from various dietary components by the average population of Arctic Canada
|
|
|
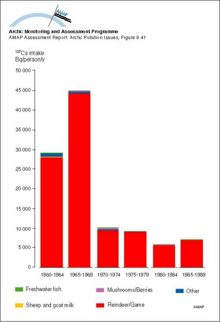
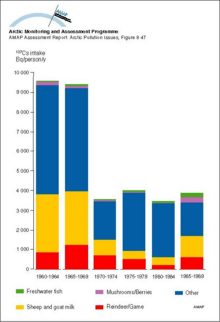
Yearly intake of 137Cs from various dietary components by the ‘selected’ population of Arctic Canada
|
|
|
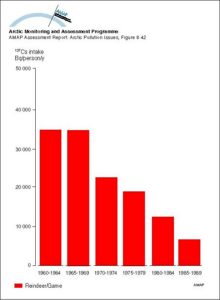
Yearly intake of 137Cs from various dietary components by the average population of Arctic Russia
|
|
|
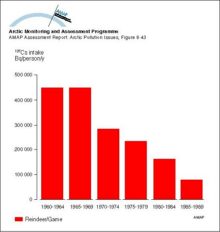
Yearly intake of 137Cs from various dietary components by the ‘selected’ population of eastern Arctic Russia
|
|
|
Yearly intake of 137Cs from various dietary components by the ‘selected’ population of western Arctic Russia
|
|
|
Yearly intake of 137Cs from various dietary components by the average population of Arctic Norway
|
|
|
Yearly intake of 137Cs from various dietary components by the ‘selected’ population of Arctic Norway
|
|
|
Yearly intake of 137Cs from various dietary components by the average population of Arctic Sweden
|
|
|
Yearly intake of 137Cs from various dietary components by the ‘selected’ population of Arctic Sweden
|
|
|
Yearly and depth-averaged concentrations (Bq/m3) of 137Cs after 6 years from Harms' model The sources are instantaneous releases of 1 PBq from the dump sites in Abrosimov Bay, Stepovogo Bay, Tsivolky [..]
|

|
|
Vertically integrated tracer burden shown after 15 years Units are burden per unit surface area, normalized by cumulative release Bottom topography is in meters; a) no neptune, centered difference, [..]
|
|
|
Source regions for HCH, chlordane, toxaphene, and PCBs in Arctic air based on 5-day back-trajectories for elevated air concentrations at Tagish, Alert, and Ny-Ålesund
|

|
|
Relative tissue concentrations of organochlorine compounds detected in lichen, and in adipose tissue of caribou and wolf at three locations in the Northwest Territories, Canada
|

|

water OR waste searches for either of these words
oceans AND biodiversity searches for blocks with both words
pollution NEAR water searches for blocks with either of these words, with them being closer ranks higher
"climate change" searches for this phrase