Your query returned 171 graphics.
Results 16 - 30
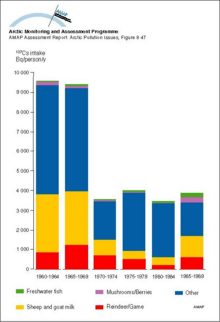
Yearly intake of 137Cs from various dietary components by the average population of Arctic NorwayYearly intake of 137Cs from various dietary components by the average population of Arctic Norway |
|
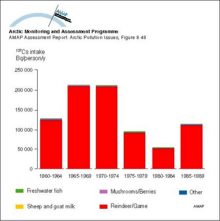
Yearly intake of 137Cs from various dietary components by the ‘selected’ population of Arctic NorwayYearly intake of 137Cs from various dietary components by the ‘selected’ population of Arctic Norway |
|
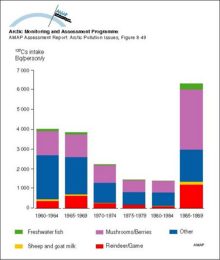
Yearly intake of 137Cs from various dietary components by the average population of Arctic SwedenYearly intake of 137Cs from various dietary components by the average population of Arctic Sweden |
|
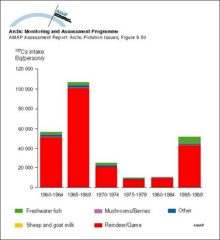
Yearly intake of 137Cs from various dietary components by the ‘selected’ population of Arctic SwedenYearly intake of 137Cs from various dietary components by the ‘selected’ population of Arctic Sweden |
|
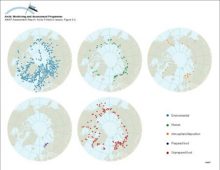
Geographical distribution of sample information in the AMAP radioactivity databaseGeographical distribution of sample information in the AMAP radioactivity database |
|
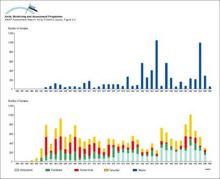
Available data in the AMAP radioactivity database as a function of timeAvailable data in the AMAP radioactivity database as a function of time |
|
Ranges and average values of 137Cs activity concentrations in food products, from data in the AMAP radioactivity databaseRanges and average values of 137Cs activity concentrations in food products, from data in the AMAP radioactivity database |

|
A comparison of the structures of the Bergen, Toronto, and Combined zonally-averaged global modelsA comparison of the structures of the Bergen, Toronto, and Combined zonally-averaged global models |

|
Distribution of radioactivity (PCi/L) in the surface layer of the ocean after ten years of simulation of Preller's model Source locations are the Ob, Yenisey and Pechora Rivers, as well as SellafieldDistribution of radioactivity (PCi/L) in the surface layer of the ocean after ten years of simulation of Preller's model Source locations are the Ob, Yenisey and Pechora Rivers, as well as Sellafield |
|
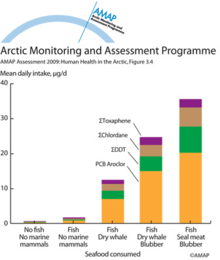
Daily intake of POPs in 90 daily food portions as a function of seafood types present in the dietDaily intake of POPs in 90 daily food portions as a function of seafood types present in the diet |
|
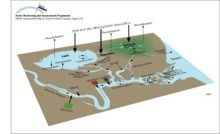
Conceptual model of the terrestrial/freshwater compartment showing the main subcompartments and contaminant transfers, and exchanges with the atmosphere and oceansConceptual model of the terrestrial/freshwater compartment showing the main subcompartments and contaminant transfers, and exchanges with the atmosphere and oceans |
|
Conceptual model of the coastal zone and marine environments showing the main subcompartments and contaminant transfers, and exchanges with the atmosphereConceptual model of the coastal zone and marine environments showing the main subcompartments and contaminant transfers, and exchanges with the atmosphere |

|
Schematic representation of shelf processes involving transport of contaminants and sea iceSchematic representation of shelf processes involving transport of contaminants and sea ice |

|
Transport of 90Sr, originating from Sellafield, along the coast of Norway The highest values are found in the Norwegian Coastal Current and decrease northwardTransport of 90Sr, originating from Sellafield, along the coast of Norway The highest values are found in the Norwegian Coastal Current and decrease northward |

|
Schematic diagram of the Combined Model Ten climatic zones, each containing well-mixed compartments, are connected by meridional atmospheric and oceanic exchangeSchematic diagram of the Combined Model Ten climatic zones, each containing well-mixed compartments, are connected by meridional atmospheric and oceanic exchange |
|

water OR waste searches for either of these words
oceans AND biodiversity searches for blocks with both words
pollution NEAR water searches for blocks with either of these words, with them being closer ranks higher
"climate change" searches for this phrase