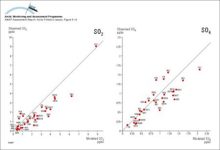
Scatterplots for comparisons between the average concentrations of SO2 and SO4 in air from October 1990 to December 1993 as monitored by the European Monitoring and Evaluation Programme (EMEP) and calculated by Christensen (1996)

Scatterplots for comparisons between the average concentrations of SO2 and SO4 in air from October 1990 to December 1993 as monitored by the European Monitoring and Evaluation Programme (EMEP) and [..]
Scatterplots for comparisons between the average concentrations of SO2 and SO4 in air from October 1990 to December 1993 as monitored by the European Monitoring and Evaluation Programme (EMEP) and calculated by Christensen (1996)

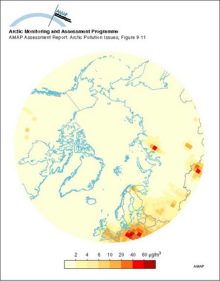
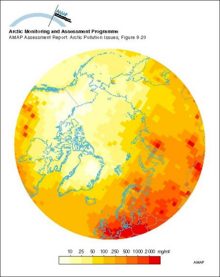
The predicted (1988) average surface air sulfate concentrations in the Arctic

The predicted (1988) average surface air sulfate concentrations in the Arctic

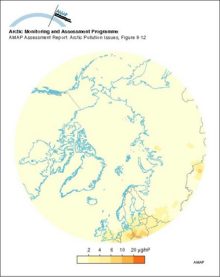
The predicted (1988) average surface air sulfur dioxide concentrations in the Arctic

The predicted (1988) average surface air sulfur dioxide concentrations in the Arctic

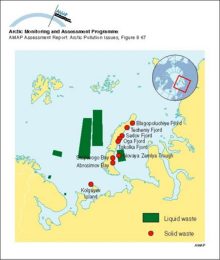
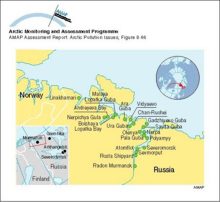
Locations of sea dumping of radioactive waste in the Russian Arctic

Locations of sea dumping of radioactive waste in the Russian Arctic

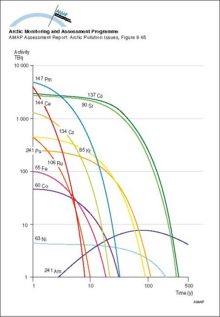
The changing inventory of major radionuclides in the Komsomolets reactor with time

The changing inventory of major radionuclides in the Komsomolets reactor with time

Major Russian naval bases along the Kola Peninsula and White Sea

Major Russian naval bases along the Kola Peninsula and White Sea

Photograph of a submarine being provided with cooling water from a supply ship

Photograph of a submarine being provided with cooling water from a supply ship

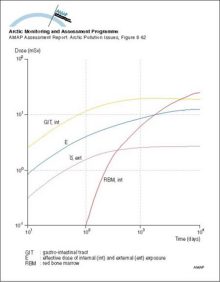
Dose accumulation in adult rural residents after the Kyshtym accident in 1957

Dose accumulation in adult rural residents after the Kyshtym accident in 1957

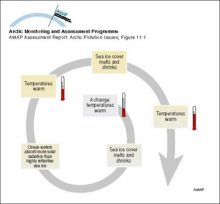
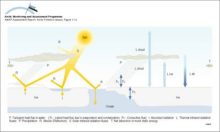
An example of a positive feedback loop Warming leads to a decrease in sea ice cover which in turn leads to a decrease in albedo over the ocean, the result of which is further warming and further decreases in the sea ice cover

An example of a positive feedback loop Warming leads to a decrease in sea ice cover which in turn leads to a decrease in albedo over the ocean, the result of which is further warming and further [..]
An example of a positive feedback loop Warming leads to a decrease in sea ice cover which in turn leads to a decrease in albedo over the ocean, the result of which is further warming and further decreases in the sea ice cover

The hydrologic balance in the Arctic is highly dynamic on the seasonal time scale with large and rapid ice melts in the spring On land, this ice and snow melting results in large rapid floods and surges in rivers

The hydrologic balance in the Arctic is highly dynamic on the seasonal time scale with large and rapid ice melts in the spring On land, this ice and snow melting results in large rapid floods and [..]
The hydrologic balance in the Arctic is highly dynamic on the seasonal time scale with large and rapid ice melts in the spring On land, this ice and snow melting results in large rapid floods and surges in rivers

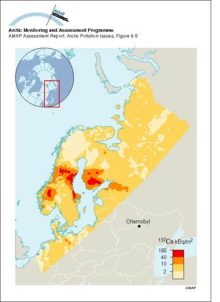
Ground deposition of 137Cs from the Chernoybl accident (values normalised to May 10, 1986)

Ground deposition of 137Cs from the Chernoybl accident (values normalised to May 10, 1986)

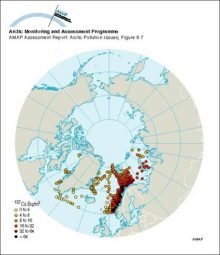
Cs-137 activity concentrations in surface seawater in 1979 and 1982

Cs-137 activity concentrations in surface seawater in 1979 and 1982

A schematic of the three-level thermodynamic snow ice system model

A schematic of the three-level thermodynamic snow ice system model

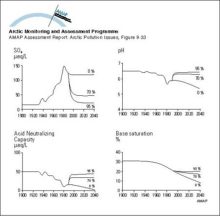
MAGIC model results for the streamwater at Dalelva for the past 90 years and for three future scenarios assuming a 0%, 70%, and 95% reduction of the present sulfur deposition levels

MAGIC model results for the streamwater at Dalelva for the past 90 years and for three future scenarios assuming a 0%, 70%, and 95% reduction of the present sulfur deposition levels

Model calculations of total (wet and dry) deposition estimates of sulfur for 1988

Model calculations of total (wet and dry) deposition estimates of sulfur for 1988


To refine your search you can combine your search strings with AND, OR, NOT and NEAR and phrases can be quoted:
water OR waste searches for either of these words
oceans AND biodiversity searches for blocks with both words
pollution NEAR water searches for blocks with either of these words, with them being closer ranks higher
"climate change" searches for this phrase