Your query returned 35 graphics.
Results 16 - 30
Contaminant emissions, transport and deposition in the ArcticAn illustration of the interplay between a) contaminant emissions distribution for sulfur dioxide and b) frequency of atmospheric south-to-north transport, yielding c) a net annual input of sulfur to [..] |

|
Temporal variation in cow milk Tag values for Sweden, Norway and FinlandTemporal variation in cow milk Tag values for Sweden, Norway and Finland |

|
Comparison of the predicted flux of 137Cs in milk and reindeer meat in different Arctic areas, for the first year after an assumed uniform deposition of 100 kBq/m2Comparison of the predicted flux of 137Cs in milk and reindeer meat in different Arctic areas, for the first year after an assumed uniform deposition of 100 kBq/m2 |

|
(a) Vertical distribution of SOx (SO2 + SO42-) concentrations averaged over the area north of 75°N, and (b) contributions from the different sources(a) Vertical distribution of SOx (SO2 + SO42-) concentrations averaged over the area north of 75°N, and (b) contributions from the different sources |

|
Summer and winter visibility observations (for relative humidities less than 80%) for the period 1951 to 1993 in North AmericaSummer and winter visibility observations (for relative humidities less than 80%) for the period 1951 to 1993 in North America |

|
(a) The contribution from the different sources to the total deposition, averaged over the area north of 75°N from October 1990 to May 1994, (b) the calculated total monthly depositions of SOx averaged over the area north of 75°N, and (c) the(a) The contribution from the different sources to the total deposition, averaged over the area north of 75°N from October 1990 to May 1994, (b) the calculated total monthly depositions of SOx [..] |

|
(a) Trajectories of five satellite-tracked buoys launched in Mackenzie Bay, Canada, and (b) results of 30-day trajectories of oil launched from five hypothetical spill locations in the Beaufort Sea(a) Trajectories of five satellite-tracked buoys launched in Mackenzie Bay, Canada, and (b) results of 30-day trajectories of oil launched from five hypothetical spill locations in the Beaufort Sea |

|
Model evaluation comparing a five-day model simulation with results of an oil release experiment in the marginal ice zone near Svalbard in April 1993Model evaluation comparing a five-day model simulation with results of an oil release experiment in the marginal ice zone near Svalbard in April 1993 |

|
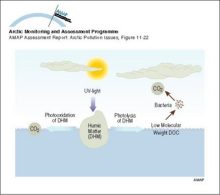
Illustration of the role of UV radiation in the biogeochemical cycling of DOCIllustration of the role of UV radiation in the biogeochemical cycling of DOC |
|
Illustration of the role of UV radiation in various light-dependent processes Natural UV radiation impacts the numbers, distribution and activity of several aquatic ecosystem targets and thus, theoretically, their interactionsIllustration of the role of UV radiation in various light-dependent processes Natural UV radiation impacts the numbers, distribution and activity of several aquatic ecosystem targets and thus, [..] |

|
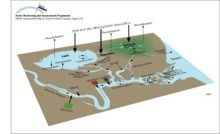
Conceptual model of the terrestrial/freshwater compartment showing the main subcompartments and contaminant transfers, and exchanges with the atmosphere and oceansConceptual model of the terrestrial/freshwater compartment showing the main subcompartments and contaminant transfers, and exchanges with the atmosphere and oceans |
|
Conceptual model of the coastal zone and marine environments showing the main subcompartments and contaminant transfers, and exchanges with the atmosphereConceptual model of the coastal zone and marine environments showing the main subcompartments and contaminant transfers, and exchanges with the atmosphere |

|
Schematic representation of shelf processes involving transport of contaminants and sea iceSchematic representation of shelf processes involving transport of contaminants and sea ice |

|
Transport of 90Sr, originating from Sellafield, along the coast of Norway The highest values are found in the Norwegian Coastal Current and decrease northwardTransport of 90Sr, originating from Sellafield, along the coast of Norway The highest values are found in the Norwegian Coastal Current and decrease northward |

|
Schematic diagram of the Combined Model Ten climatic zones, each containing well-mixed compartments, are connected by meridional atmospheric and oceanic exchangeSchematic diagram of the Combined Model Ten climatic zones, each containing well-mixed compartments, are connected by meridional atmospheric and oceanic exchange |

|

water OR waste searches for either of these words
oceans AND biodiversity searches for blocks with both words
pollution NEAR water searches for blocks with either of these words, with them being closer ranks higher
"climate change" searches for this phrase